070 + betta Alexander Shemetev
070.jpg:138x58, 2k
|
|
|
|
070 + betta Alexander Shemetev 070.jpg:138x58, 2k |
 Alexander Shemetev's photo Alexander Shemetev alex123.jpg:189x190, 9k |
|
Let us, for example, calculate the total ranking score for the company number 1 at the market. Alexander Shemetev e1.jpg:1423x58, 14k |
 In the normal version, the payback period is: Alexander Shemetev e10.jpg:742x78, 12k |
|
Further analysis is necessary. In the worst case scenario payback period is: Alexander Shemetev e11.jpg:738x53, 7k |
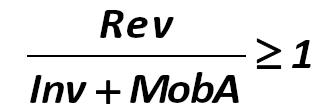
 And before it, there should be set the measure of the profitability / risk of leverage: Alexander Shemetev e12.jpg:923x231, 35k |
 Let’s go back to the analysis of JSC "Wave". Let us now examine the rate of return / total risk for the firm: Alexander Shemetev e13.jpg:802x266, 30k |
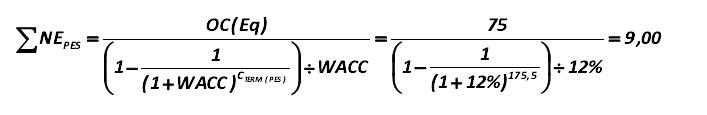 Then you should see the pessimistic variant for sum. NE: Alexander Shemetev e14.jpg:707x115, 11k |
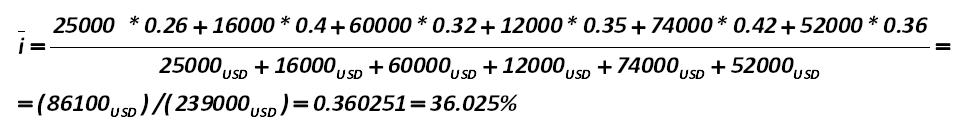 For our example, the average rate on loans under this procedure will be: Alexander Shemetev e2.jpg:961x124, 24k |
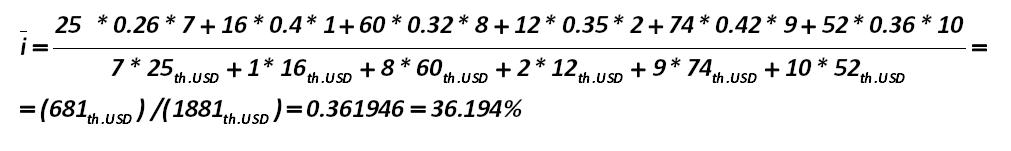 For our example, the rate on the loan will be : Alexander Shemetev e3.jpg:1011x151, 25k |
 Then the expected value of the actual, including the hidden interests, average market interest is: Alexander Shemetev e4.jpg:1150x133, 20k |
 Let’s now define default factors: Alexander Shemetev e5.jpg:356x88, 4k |
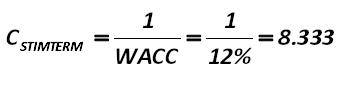
 The specified value indicates that the capital of JSC "Wave" should turn around in less than 8.333 years, otherwise the company will not cover the cost of its existence in the market for some of the indicators. Alexander Shemetev e6.jpg:431x89, 5k |
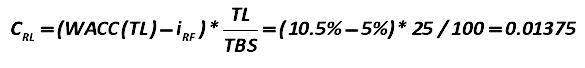 Let’s calculate the risk ratio of leverage: Alexander Shemetev e7.jpg:585x68, 7k |
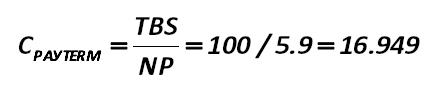
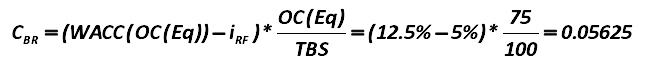 Now, let's get together with you, dear reader, calculate the value of the indicator-rate of business risk: Alexander Shemetev e8.jpg:652x68, 7k |
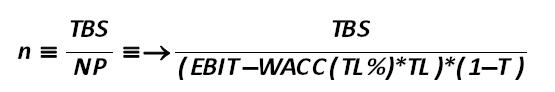
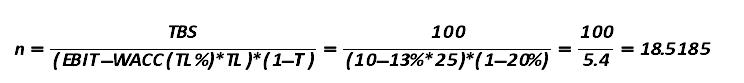 Let’s calculate the coefficient n, which will be used later: Alexander Shemetev e9.jpg:744x83, 9k |
|
ebit formula Alexander Shemetev ebit.jpg:210x27, 2k |
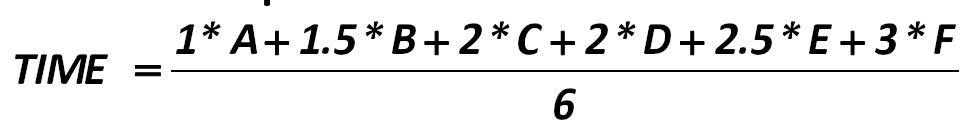
 Thus, the first component of the remaining time term on the anti-crisis strategies’ use for companies is: Alexander Shemetev f-22.jpg:431x129, 7k |
|
The formula for the ranking rate indicator in this model will be next. Alexander Shemetev f0.jpg:537x41, 4k |
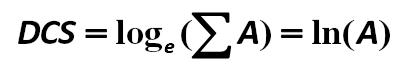 Discriminant company size (DCS) – is the natural logarithm of total assets of a company: Alexander Shemetev f01.jpg:396x64, 5k |
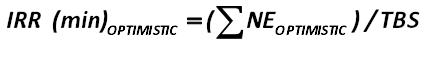 The minimum IRR in the long term for the optimistic scenario is: Alexander Shemetev f0154.jpg:429x59, 5k |
 This is a critical indicator of the investment cycle Alexander Shemetev f081.jpg:468x131, 10k |
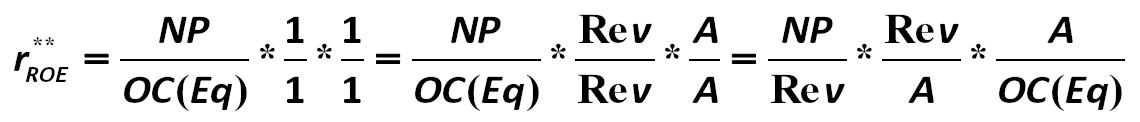 Dupont model derived from the very simple formula: return on equity. Let's analyze it: Alexander Shemetev f1.jpg:1140x122, 20k |
 An indicator of the urgent problems in the operational and marketing cycles Alexander Shemetev f10.jpg:233x122, 5k |
|
The presence of this negative trend is especially harmful to subsidiary companies (the share of ownership is greater than 50%) and affiliated companies (the share ownership is above 20% for the right to participate in management, and it is less than 50%), as well as for joint-stock-companies (JSC), because it may lead to a massive outflow of investment from business, which may take the company off the market, further dropping the performance of its activities. Alexander Shemetev f100.jpg:994x46, 12k |
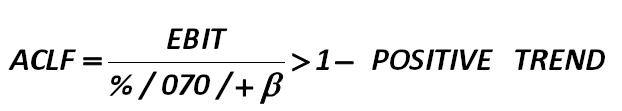 Credit leverage / ACLF /, in my opinion, can be attributed to indicators for signs of financial instability with respect to the Russian reality. The formula for calculating is the following: Alexander Shemetev f101.jpg:622x111, 8k |
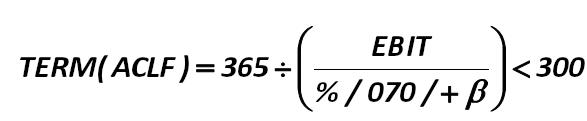 The period of work for the creditors of the year (TERM(ACLF)) for any company is: Alexander Shemetev f102.jpg:587x121, 8k |
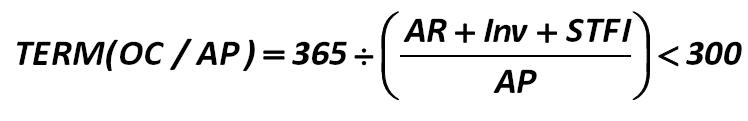 Then, the period during which the principal operating cycle is directed to work in accounts payable (TERM(OC/AP)) is calculating according to formula, developed by Alexander Shemetev, who is the author of this paper: Alexander Shemetev f103.jpg:748x121, 11k |
|
If the timing for (102) and (103) is more than 300 days, when it is expressed in the formula, developed by the author of this paper: Alexander Shemetev f104.jpg:789x44, 9k |
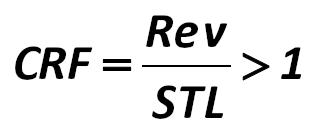 However, in addition, it is necessary to calculate and financial cycle, which can be viewed on the coverage ratio formula CRF: Alexander Shemetev f105.jpg:312x137, 5k |
 If this inequality is not satisfied, then it suggests that bankruptcy may soon move into a definite form, and the situation requires emergency measures, because it shows that to maintain the normal cycle of the company there soon will be the need to get the value of borrowed funds, greater than (it is calculated according to formula, developed by the author of this paper): Alexander Shemetev f106.jpg:769x98, 9k |
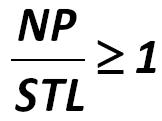
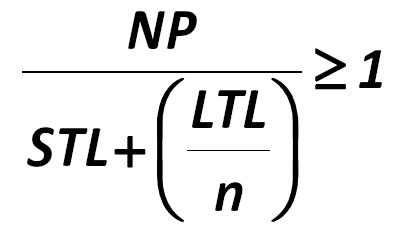
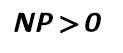 And the last important parameter is the net profit (NP), which should be clearly greater than 0: Alexander Shemetev f107.jpg:123x53, 1k |
|
Thus, the stage of financial instability – how to reveal it? There must be evaluated complex coefficient, developed by Alexander Shemetev (108): Alexander Shemetev f108.jpg:1315x100, 17k |
 At the first stage, there is estimated the rate of permanent presence of working capital (PPWC) by the formula: Ural State University after A.M. Gorky research f109.jpg:530x58, 6k |
 An indicator of the urgent problems in the investment cycle Alexander Shemetev f11.jpg:433x146, 10k |
|
In the second stage, there are calculated normal sources of supplies (NSS): Ural State University after A.M. Gorky research f110.jpg:727x58, 9k |
|
Absolute financial stability appears if: Ural State University after A.M. Gorky research f111.jpg:246x48, 3k |
 Normal financial stability appears if: Ural State University after A.M. Gorky research f112.jpg:338x63, 4k |
 Precarious financial situation appears if: Ural State University after A.M. Gorky research f113.jpg:238x60, 3k |
 An indicator of long-term risks in the financial cycle of the firm Alexander Shemetev f12.jpg:184x152, 4k |
|
Also of note is how one calculates the amount of net working capital (NWC), which is used in the formula Alexander Shemetev f121.jpg:244x39, 2k |
|
How do you, dear reader, have guessed, the above formula cells were calculated as follows at the above matrix: Alexander Shemetev f122.jpg:263x30, 3k |
 And now, dear reader, let's move on to the assessment of additional factors of financial stability, developed by the Alexander Shemetev in order an analyst to be able to determine precisely the degree of financial stability of a single company in the market. These indicators are: Alexander Shemetev f138.jpg:228x76, 3k |
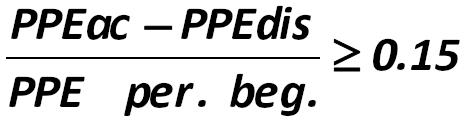
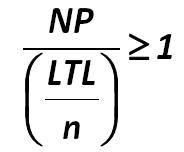
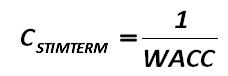
 Where: WACC – is the weighted average cost of this capital. Cstimterm – is a ratio of stimulated term of return on investment, which shows for how many similar analyzed periods company should pay off to offset the costs associated with the use of equity and debt capital. It is desirable that this ratio was greater than the ratio: Alexander Shemetev f139.jpg:178x80, 2k |
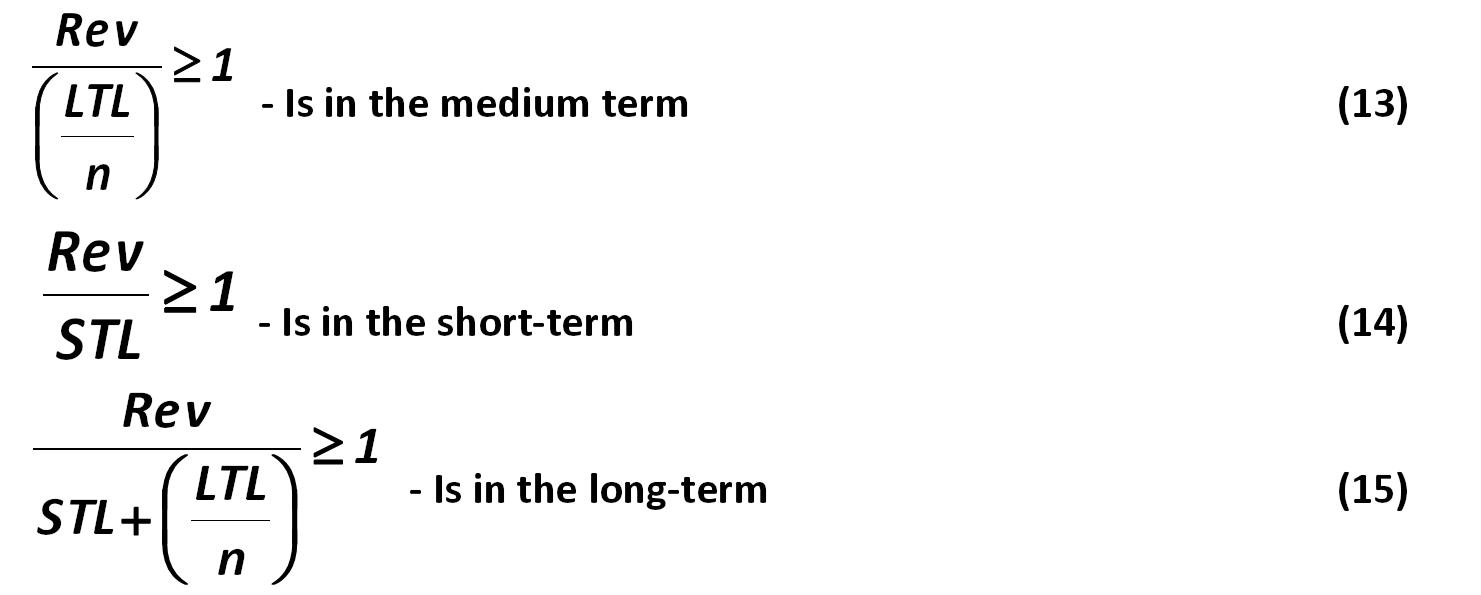 In principle, the critical indicators that show whether your company is able to cover its debts are the following: Alexander Shemetev f13_15.jpg:1481x595, 44k |
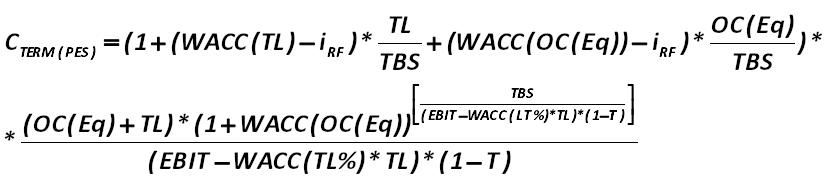 I) In the pessimistic scenario the forecast payback period is equal to (140): Alexander Shemetev f140.jpg:831x186, 23k |
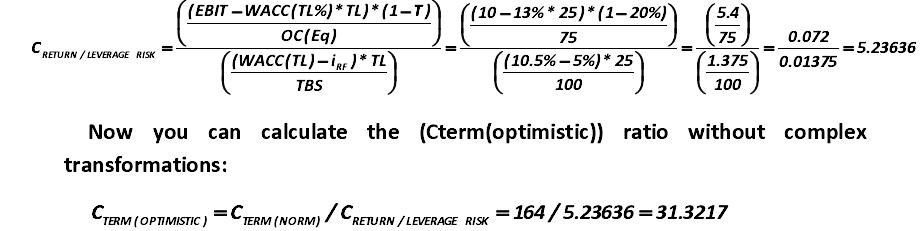
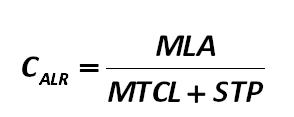
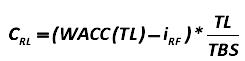 Let's start with a review of the business risk of loss of pay due to a lack of liquid assets to pay off borrowings. Alexander Shemetev believes that this value can be estimated using the developed by him ratio of risk leverage: Alexander Shemetev f141.jpg:245x61, 3k |
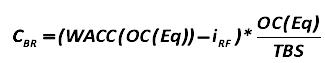 In any case, such company expected to receive some rate of return, and in fact it may get a lower rate of return than expected. The total value of this risk can be expressed in a formula developed by Alexander Shemetev: Alexander Shemetev f142.jpg:325x63, 4k |
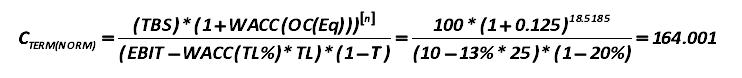
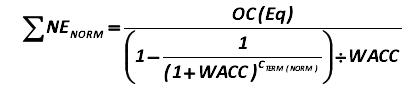
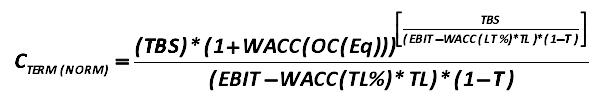 II) Let’s go back to our development scenarios in the market and their evaluation. The second component of the pessimistic-scenario-of-events-formula we are considering – is the a normal scenario of events’ development, payback period for which is (Cterm(norm)): NORM Alexander Shemetev f143.jpg:596x108, 12k |
 Thus, the rate of (1 + WACC (OC(Eq)) is elevated to some degree n, which reflects the normal payback period of investment: Alexander Shemetev f144.jpg:555x92, 7k |
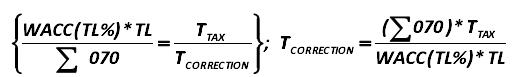 Now, let’s go back to the coefficient of correction: Alexander Shemetev f145.jpg:524x77, 8k |
|
Now, let’s go back to the coefficient of correction: Alexander Shemetev f146.jpg:366x37, 4k |
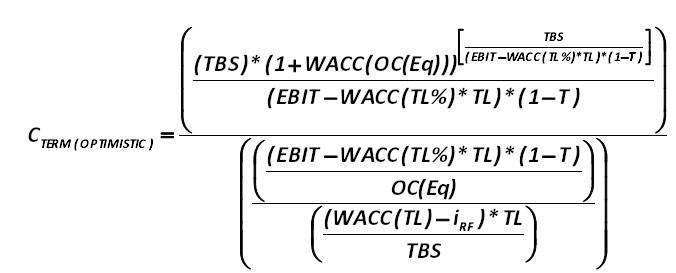 II) We are with you, dear reader, already touched the themes for pessimistic and normal scenarios for firms’ development. Let us now consider the best one, an optimistic scenario and an optimistic version of the payback period of investment. It can easily be calculated by the formula developed by Alexander Shemetev: Alexander Shemetev f148.jpg:676x273, 24k |
 The lower part of the formula (148) is also a factor showing the degree of financial stability in the market. Now, let's consider the following formula developed by Alexander Shemetev (149): Alexander Shemetev f149.jpg:776x192, 18k |
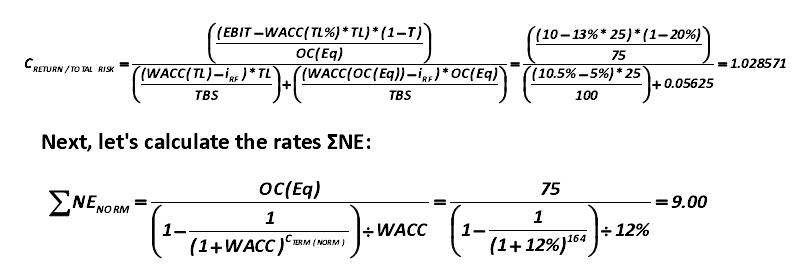
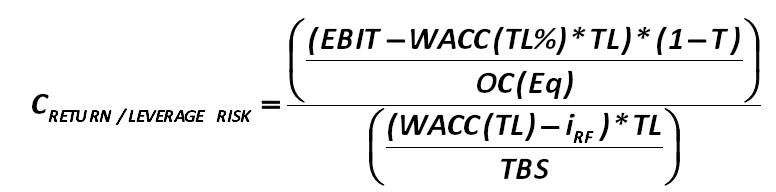
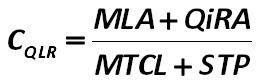
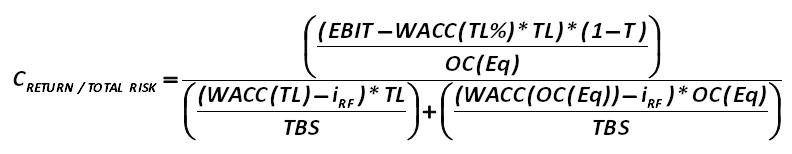 There is also a more general cost-effectiveness ratio for risk (Creturn/total risk), which assesses not only the risk of financial leverage for the company, and also it assesses the total business risk. This indicator is calculated by the formula developed by Alexander Shemetev (150): Alexander Shemetev f150.jpg:792x154, 17k |
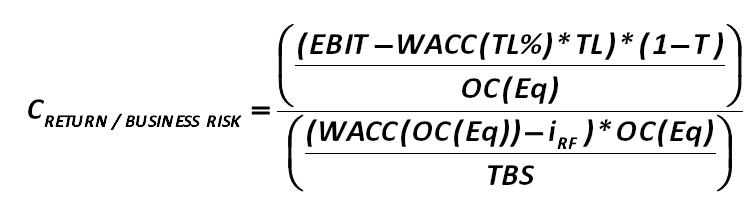 If not - you should consider: what rate of return the company does not cover: lenders’ (risk-based formula (149)) or investors (holders of shares of the company) (Creturn/business risk), which is calculated from a formula developed by Alexander Shemetev (151 ): Alexander Shemetev f151.jpg:747x198, 19k |
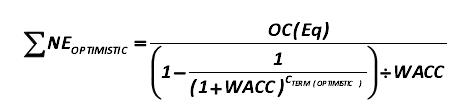
 The value of this income (?NE) for a single company would be calculated by the formula developed by the author: Alexander Shemetev f152.jpg:412x95, 6k |
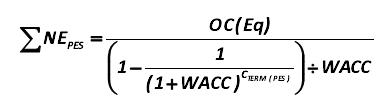 You should also calculate the (?NE) amount under the pessimistic scenario, which would be calculated by the formula developed by Alexander Shemetev: Alexander Shemetev f153.jpg:392x103, 6k |
 Also, for reference, there should be calculated the (?NE) value for an optimistic forecast, which will be calculated by the formula developed by Alexander Shemetev: Alexander Shemetev f154.jpg:458x112, 6k |
|
The minimum IRR in the long term at a normal scenario is: Alexander Shemetev f155.jpg:362x49, 4k |
|
The minimum IRR in the long run when the pessimistic scenario is: Alexander Shemetev f156.jpg:325x49, 4k |
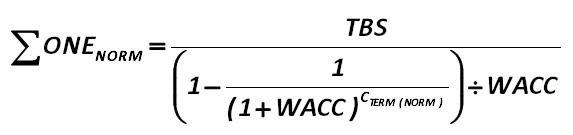 The value of this income (?ONE) for a single company would be calculated by the formula developed by Alexander Shemetev: Alexander Shemetev f157.jpg:573x135, 9k |
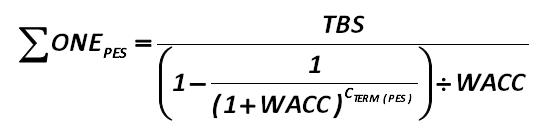 You should also calculate the (?ONE) amount under the pessimistic scenario, which would be calculated by the formula developed by Alexander Shemetev: Alexander Shemetev f158.jpg:542x136, 8k |
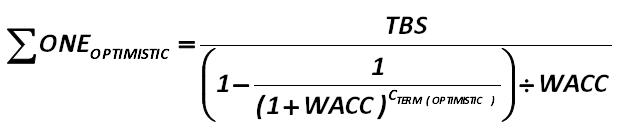 It also should be calculated the (?ONE) value with an optimistic forecast, which will be calculated by the formula developed by Alexander Shemetev: Alexander Shemetev f159.jpg:621x136, 9k |
 This is a measure of the normal state of operational and marketing cycles in the long run Alexander Shemetev f16.jpg:313x107, 5k |
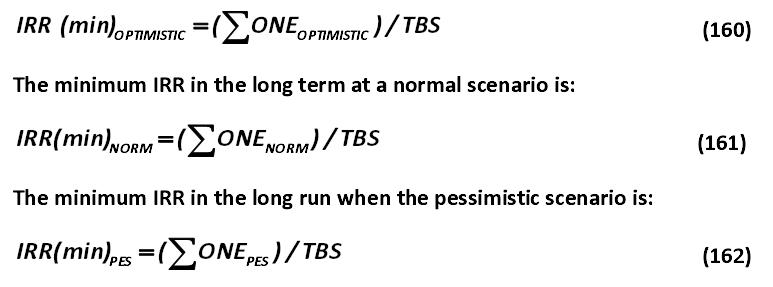 Internal rate of return on the company as a whole in this case would be calculated by the following formulas developed by Alexander Shemetev. Alexander Shemetev f160_162.jpg:773x287, 28k |
|
It should be noted that the amount of income tax is not givenfor the organization, and, in this case, it is approximately 20%, which was calculated using the formula for this sample (163): Alexander Shemetev f163.jpg:807x29, 7k |
 An indicator of the normal state of the investment cycle Alexander Shemetev f17.jpg:503x208, 11k |
 This ratio is the ratio of realized within about a year assets to current liabilities, and it is determined by formula: f173.jpg:408x99, 8k |
 It can be calculated by the formula (174): f174.jpg:267x81, 5k |
 Ready money – this is, firstly, the monetary funds themselves, and, secondly, the assets of instant liquidity (which can be exchanged for money within about three days) In the Russian reality, this ratio is calculated as follows: f175.jpg:294x117, 4k |
|
The value of net working capital (NWCv) is calculated by the formula: f177.jpg:472x35, 5k |
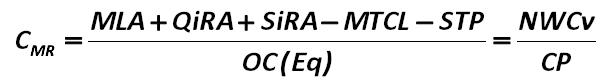 The maneuverability reserve for a business indicator (Cmr) itself is calculated by the formula, developed by the author of this paper: Alexander Shemetev f178.jpg:609x83, 9k |
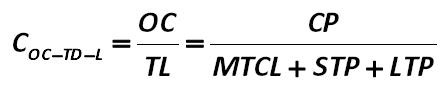 The ratio of equity to debt in terms of liquidity (Coc-td-l) is calculated by the formula, developed by the author of this paper: Alexander Shemetev f179.jpg:446x91, 6k |
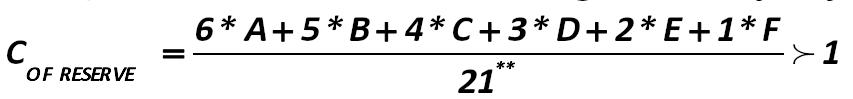 Thus, the formula for calculating the company’s risk reserve is the following: Alexander Shemetev f18.jpg:853x99, 11k |
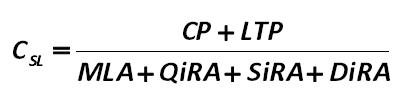 The overall financial sustainability through the lens of liquidity will be considered by the coefficient of specific liquidity, developed by Alexander Shemetev (Csl): Alexander Shemetev f180.jpg:412x92, 6k |
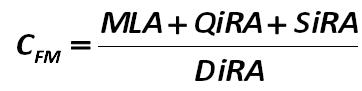 Coefficient of funds’ mobility (Cfm) is calculated by the formula, developed by the author of this paper: Alexander Shemetev f181.jpg:362x91, 6k |
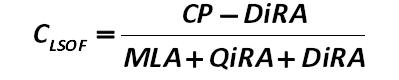 The ratio of liquidity supply of own funds (Clsof) is calculated by the formula developed by Alexander Shemetev: Alexander Shemetev f182.jpg:399x80, 6k |
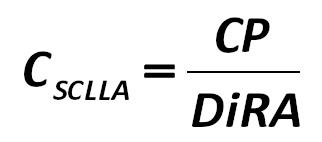 The coefficient of self-coverage of long-lived assets (Csclla) is calculated by the formula, developed by the author of this paper: Alexander Shemetev f183.jpg:322x142, 5k |
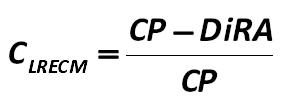 It should also be noted the developed by Alexander Shemetev liquidity ratio of equity capital mobility (Clrecm): Alexander Shemetev f184.jpg:282x101, 4k |
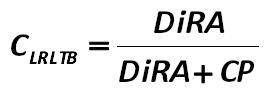 Alexander Shemetev has developed a liquidity ratio of long-term borrowing (Clrltb), which is calculated as follows: Alexander Shemetev f185.jpg:275x93, 4k |
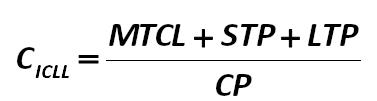 Alexander Shemetev has developed an interrelation coefficient of liquid liabilities (Cicll): Alexander Shemetev f186.jpg:377x101, 5k |
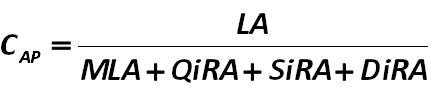 Along with these factors, it is necessary to calculate the proportion of each asset in the company property (Cap) for the financial analysis, which can be calculated using the formula developed by the author of this paper: Alexander Shemetev f187.jpg:448x101, 6k |
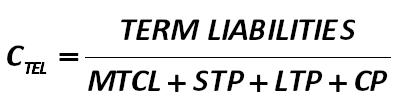 Similarly, it is necessary to calculate also the share of term liabilities in the company's passive (Ctel), which can be made by using the formula developed by the author of this paper: Alexander Shemetev f188.jpg:401x104, 8k |
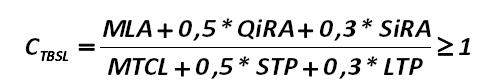 The coefficient of the total balance sheet liquidity (Ctbsl): f189.jpg:485x82, 9k |
 The calculation of the actual reserve should be made by the following formula: Alexander Shemetev f19.jpg:382x64, 5k |
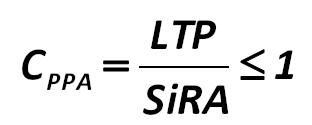 Coefficient of prospective pay-ability (Cppa): f190.jpg:312x125, 5k |
 f192.jpg:492x85, 7k |
 f193.jpg:281x94, 5k |
 f194.jpg:281x164, 6k |
|
f195.jpg:729x45, 8k |
  Alexander Shemetev Alexander Shemetevf20.jpg:964x127, 13k |
 Thus, the first component of the remaining time term on the anti-crisis strategies’ use for companies is: Alexander Shemetev f21.jpg:431x129, 7k |
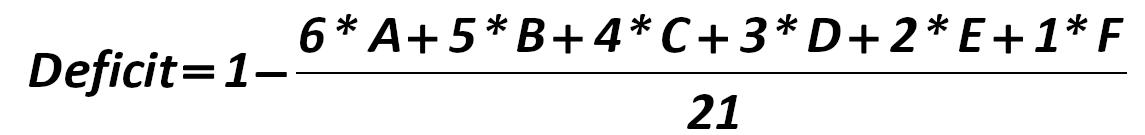 So, I think, you’ve got an acquaintance with the deficit. Let’s see it another one time, and this time relative to the time that a company has for the anti-crisis-strategies’ implementation can be calculated by the formula developed by the author of this paper: Alexander Shemetev f22.jpg:1145x135, 17k |
 Then the deficit base will be determined by the formula developed by the author of this paper: Alexander Shemetev f23.jpg:1252x106, 17k |
 The remaining time on anti-crisis measures in the functioning of the company's financial, operational and marketing cycles can be determined by the formula developed by the author of this paper(24): Alexander Shemetev f24.jpg:1517x199, 30k |
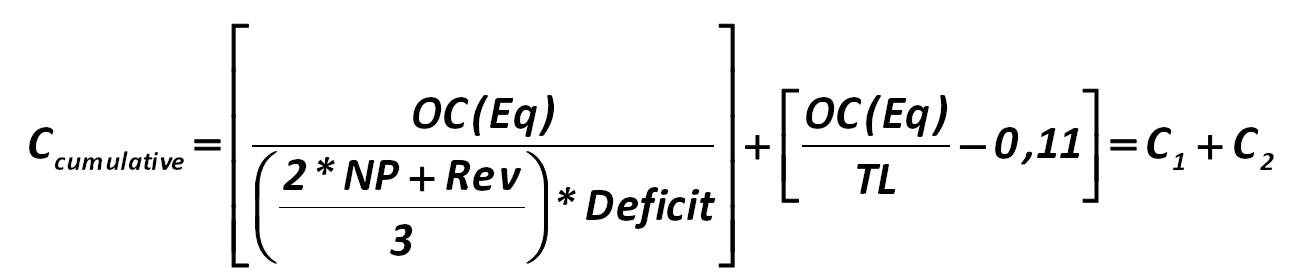 The cumulative time of risks’ concentration is calculated as follows: Alexander Shemetev f25.jpg:1294x273, 26k |
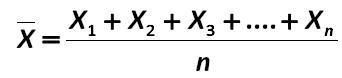 of indicators. Now, let’s see the average is calculated by the following formula: Alexander Shemetev f45.jpg:342x78, 4k |
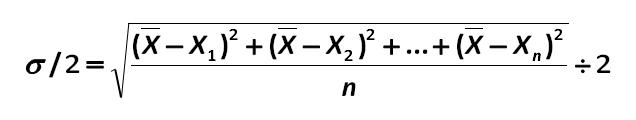 The average deviation from the mean value – is an half of the standard deviation: Alexander Shemetev f45_1.jpg:636x120, 9k |
 The formula for the approximated rate is as follows Alexander Shemetev f48.jpg:440x152, 6k |
 Author for a more accurate calculation offers you, dear reader, to use a sufficiently mobile and simple, and at the same time, a fairly accurate formula for calculating the price of debt. This formula was developed by the author of this 3 paper. The formula is as follows : Alexander Shemetev f49.jpg:521x119, 7k |
 However, the model requires some mathematical calculations. f50.jpg:352x158, 5k |
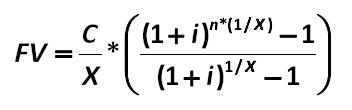
 Then the entire cost of funds, which the company will return to the repayment of outstanding debt will be equal to (when paid annually, and interest once a year – it is taken to simplify the calculations, because essentially, it does not change the 3 calculations ): Alexander Shemetev f51.jpg:887x186, 16k |
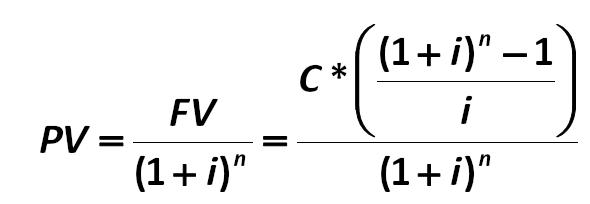
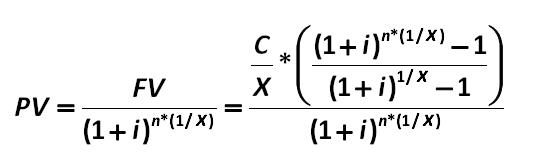
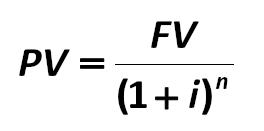 It is sometimes better to proceed from the known exactly data: the amount initially 1 granted funds (PV) , which is calculated as follows: f52.jpg:264x131, 4k |
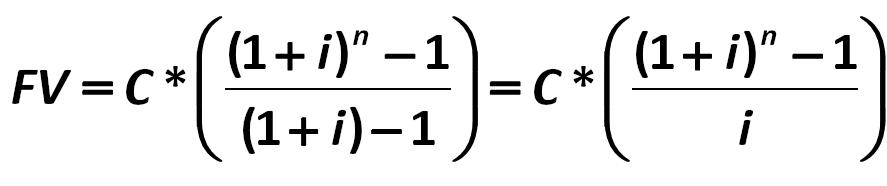
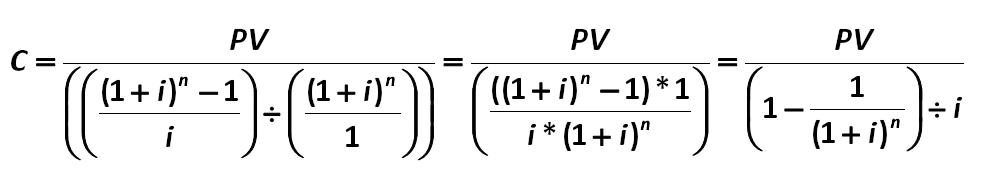
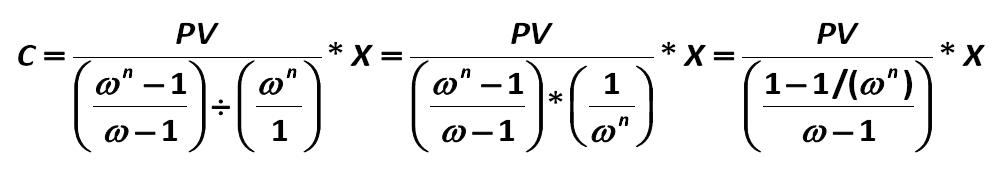
 If then, as we know how FV is calculated, let us derive the value of the annual yment on the loan with interest from the formula: Alexander Shemetev f53.jpg:590x204, 11k |
 This payment is equal to (54): Alexander Shemetev f54.jpg:988x170, 19k |
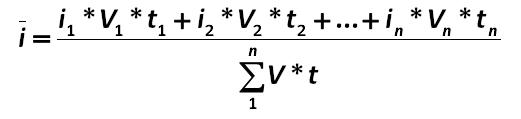
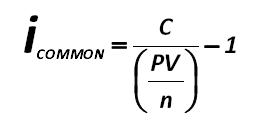
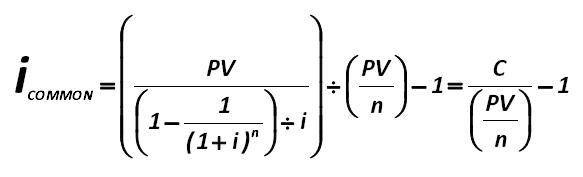 For the individual loan, average interest rate will be calculated using the formula: Alexander Shemetev f55.jpg:583x177, 11k |
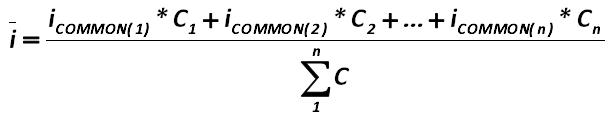
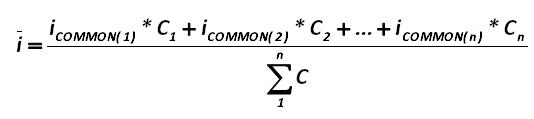 It should be noted that this formula calculates the hidden interest in credit, in particular, actually paid each period. The average interest rate throughout the whole loan capital of the company will be: Alexander Shemetev f56.jpg:534x119, 7k |
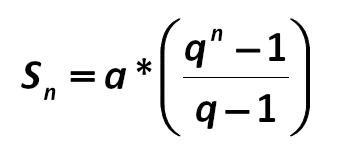
 The sum of all payments on it - this is the same geometric progression: f58.jpg:352x110, 6k |
 Let’s back to our formula (52) and let’s substitute the resulting value: f59.jpg:549x167, 11k |
 Let us, dear reader, now calculate the total payment for such credit (let’s 1/x denote (1+i) = OMEGA)) (60) f60.jpg:997x182, 20k |
 The average interest cost of the loan, including the hidden interest is: Alexander Shemetev f61.jpg:260x130, 4k |
 And the average cost of debt capital (%) is as follows: Alexander Shemetev f62.jpg:609x119, 9k |
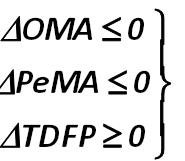
 1. Absolute Stability: Alexander Shemetev f69.jpg:203x161, 6k |
 This is a critical factor of the financial cycle Alexander Shemetev f7.jpg:162x121, 3k |
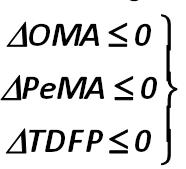
 2. Normal stability, guaranteeing the solvency of the enterprise: Alexander Shemetev f70.jpg:185x157, 6k |
 3. Precarious financial condition, it is characterized by a violation of the company's solvency, when rebalancing is possible due to the replenishment of sources of equity and accelerate the turnover of stocks: Alexander Shemetev f71.jpg:185x161, 6k |
 4. The critical financial situation in which the company is insolvent and is on the verge of bankruptcy, because the main element of working capital – inventories – does not provide a source of their coverage: Alexander Shemetev f72.jpg:186x169, 7k |
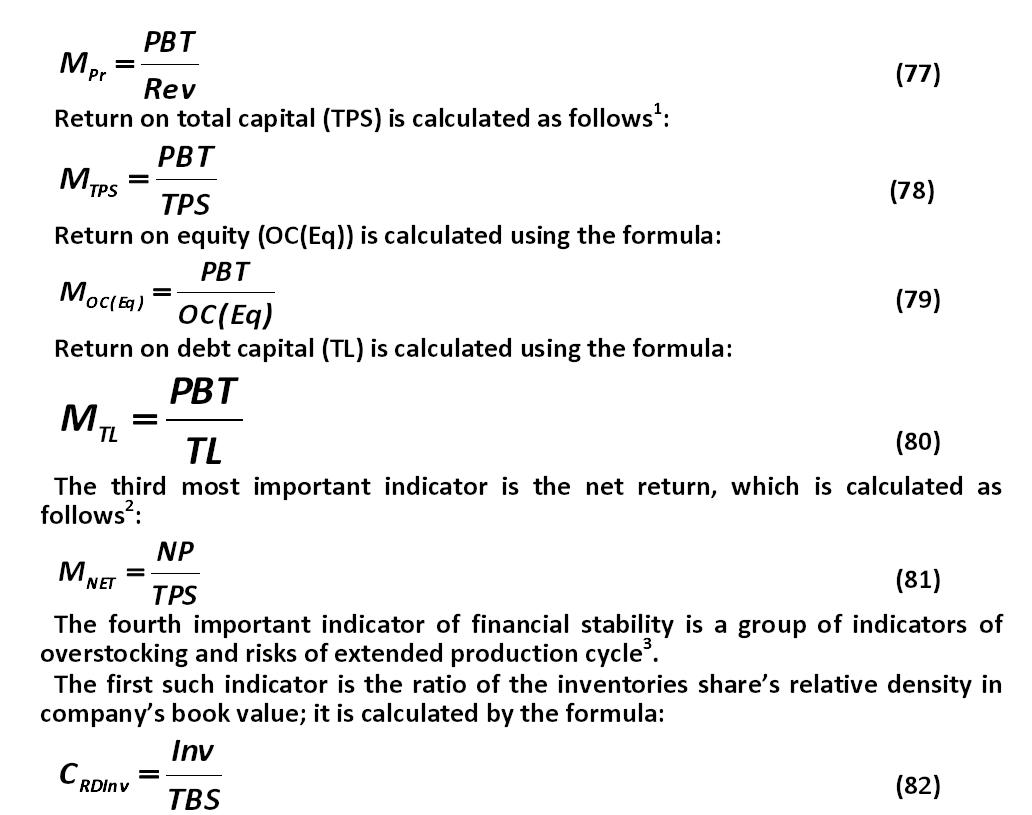 Formulas 77 - 82 Alexander Shemetev f77_82.jpg:1032x815, 89k |
 – This is a critical indicator of risk concentrations of two cycles Alexander Shemetev f8.jpg:170x144, 3k |
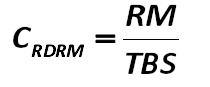 The next factor of this group of indicators is the measure of proportion of raw materials and other similar values in the firm’s balance value: Alexander Shemetev f83.jpg:210x87, 3k |
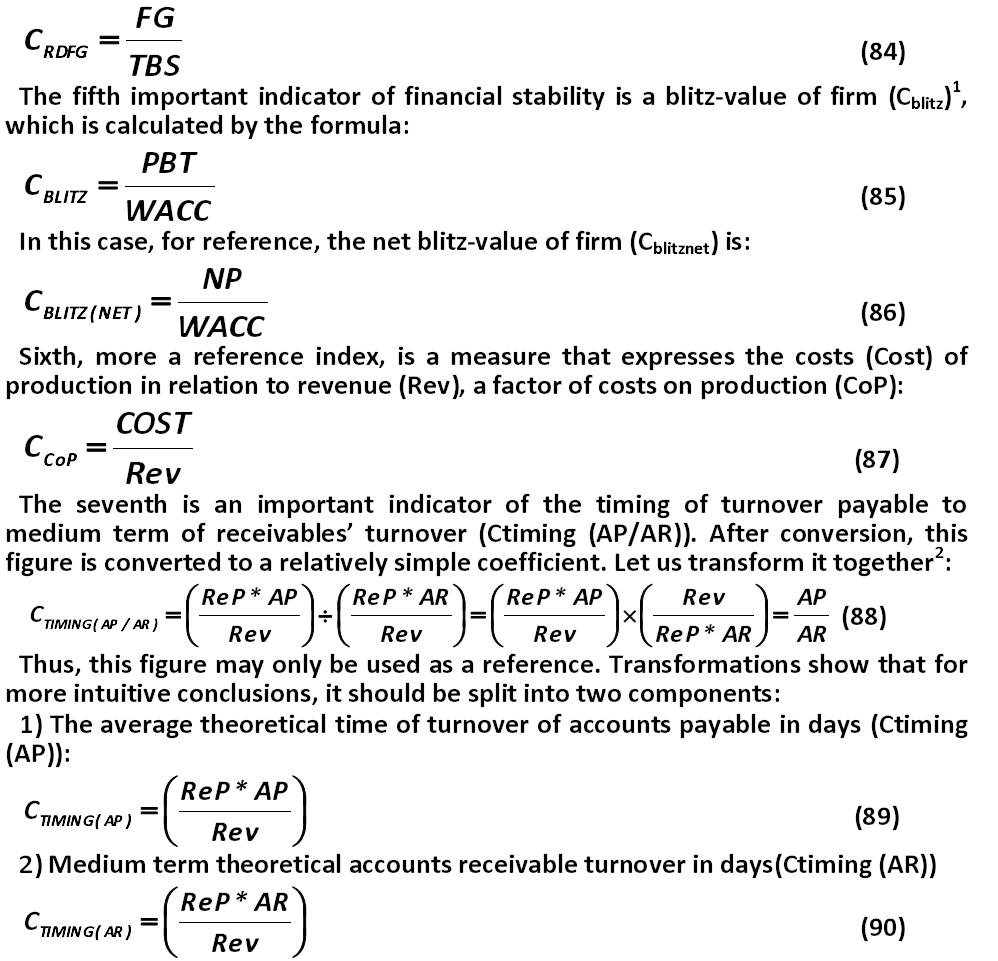 Formulas 84 - 90 Alexander Shemetev f84_90.jpg:998x961, 151k |
 An indicator of the urgent problems in the financial cycle Alexander Shemetev f9.jpg:400x228, 9k |
|
ReP – this is the reporting period in days. For example, for the year it is 365 days. 3 It is also important to know the value of net assets, calculated by the formula : Alexander Shemetev f91.jpg:378x40, 4k |
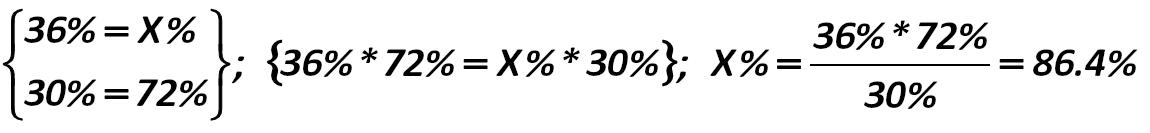
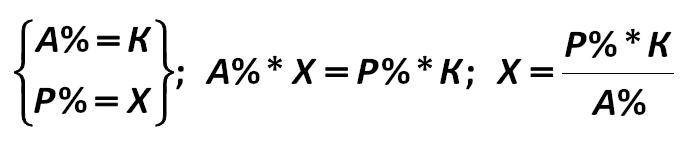
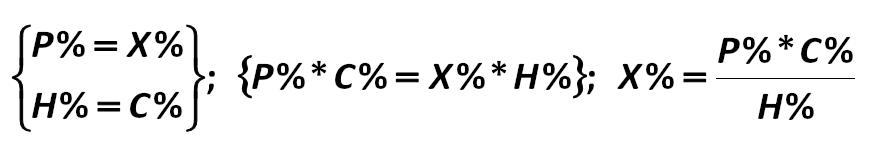 Identifying the proportion is carried out on the basis of the Basic Law of the proportions, which is expressed by the following formula: Alexander Shemetev f92.jpg:889x160, 15k |
 Mathematically, this operation is the 1 calculation as follows : Alexander Shemetev f93.jpg:515x143, 9k |
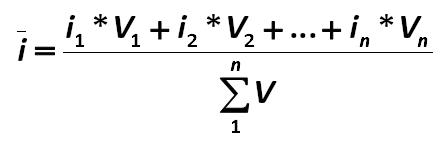
 The process of linear mathematical expectation of borrowed funds cost is calculated as: Alexander Shemetev f94.jpg:694x143, 11k |
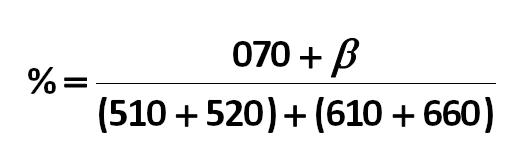
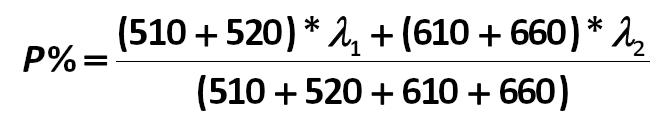 P% – is a market average rate on loans for a company. It is equal to: Alexander Shemetev f95.jpg:658x114, 13k |
|
It is also possible to construct a linear expectation value of , which is equal to: Alexander Shemetev f96.jpg:796x60, 10k |
 Secondly, you should also calculate the formula for signs of latent stage of bankruptcy (LBS), which is developed by the author of this paper (97): Alexander Shemetev f97.jpg:1048x102, 13k |
|
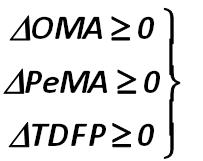
So, what are the indicators, in addition to the above parameters, which are under latent bankruptcy, saying that the company is in the process of financial instability? The indicators are: Alexander Shemetev f98.jpg:1208x51, 13k |
|
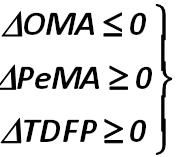
The other negative trend is next: Alexander Shemetev f99.jpg:992x62, 12k |
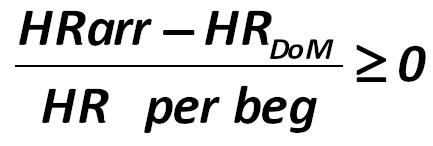
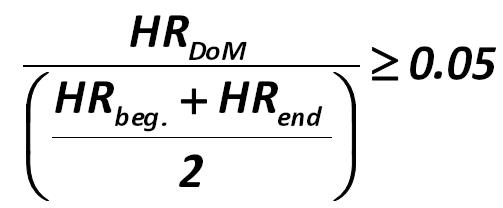
 HR formula Alexander Shemetev hr.jpg:212x84, 4k |
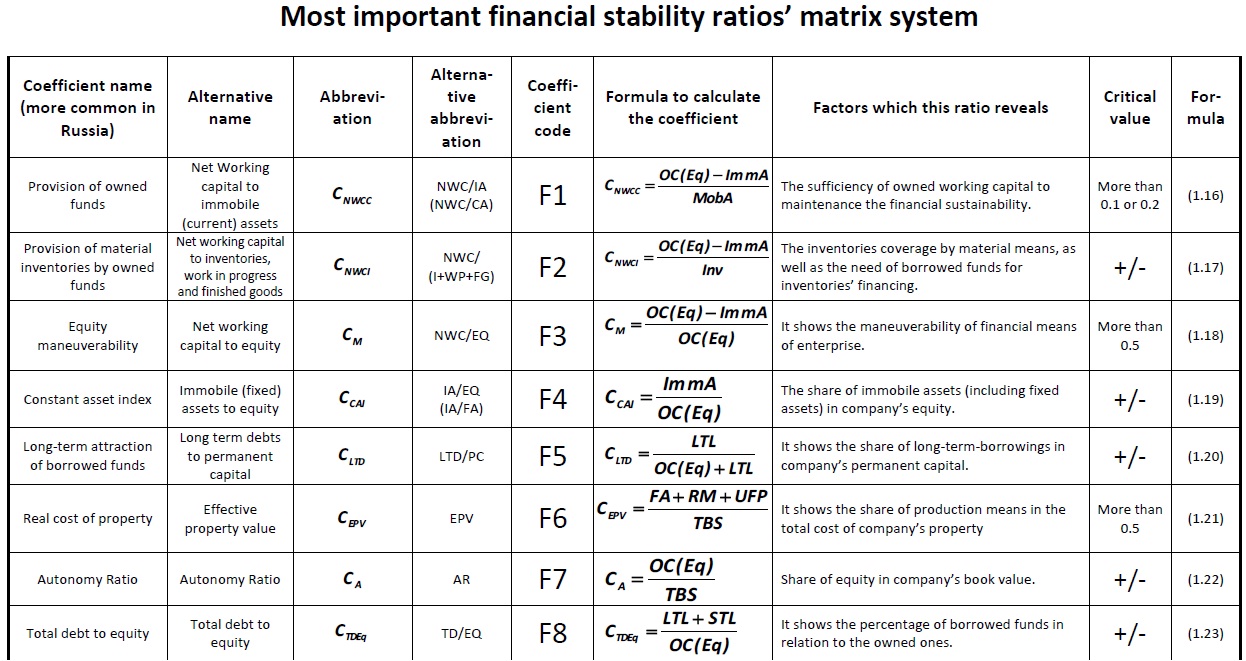 So, let's get together with you proceed to consider the matrix system of the most important indicators of financial stability. Alexander Shemetev ms1.jpg:1246x661, 277k |
 Matrix system of financial effectiveness Alexander Shemetev ms10.jpg:1138x395, 161k |
 So, let's get together with you proceed to consider the matrix system of the most important indicators of financial stability. Alexander Shemetev ms2.jpg:1241x518, 225k |
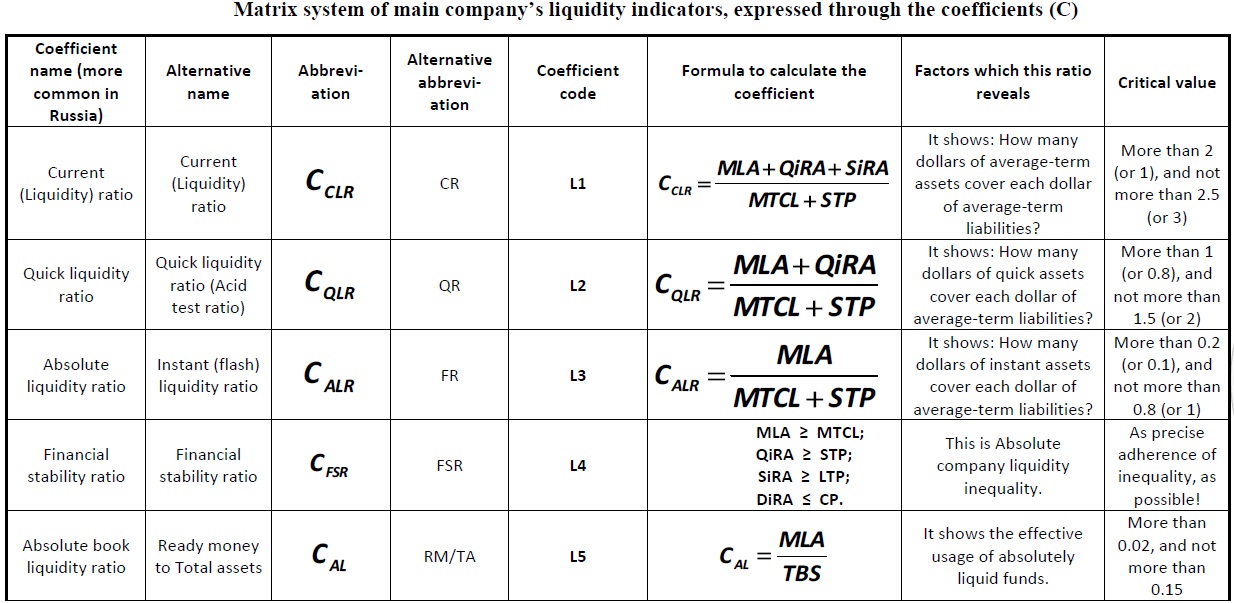 Liquidity ratios matrix system Alexander Shemetev ms3.jpg:1234x603, 240k |
 Matrix system of financial effectiveness Alexander Shemetev ms4.jpg:1131x610, 217k |
|
Matrix system name Alexander Shemetev ms4name.jpg:1292x24, 23k |
 Matrix system of financial effectiveness Alexander Shemetev ms5.jpg:1133x684, 255k |
 Matrix system of financial effectiveness Alexander Shemetev ms6.jpg:1132x677, 235k |
 Matrix system of financial effectiveness Alexander Shemetev ms7.jpg:1130x710, 239k |
 Matrix system of financial effectiveness Alexander Shemetev ms8.jpg:1133x689, 211k |
 Matrix system of financial effectiveness Alexander Shemetev ms9.jpg:1131x691, 245k |
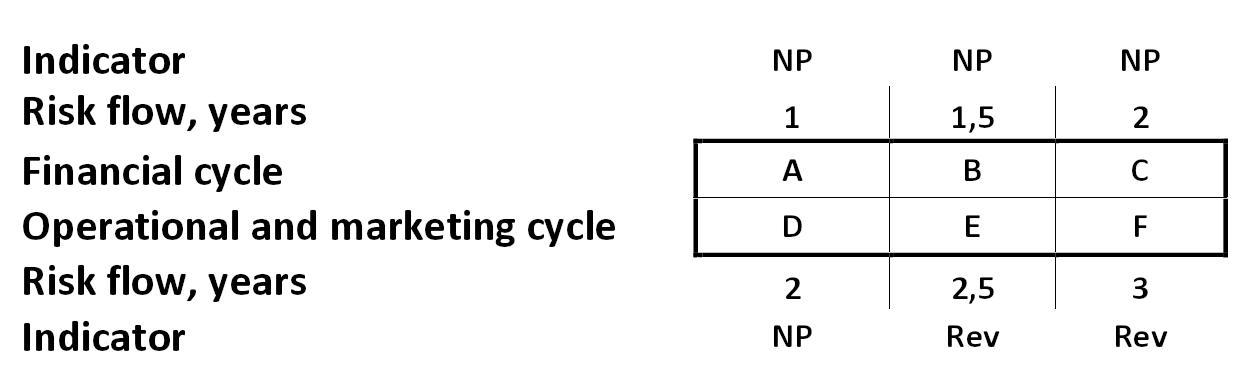 Risky streams cycles’ and risk components’ rates decomposition matrix Alexander Shemetev rsc.jpg:1237x385, 41k |
 At the same time, it is important the theoretical value of WACC, which is based mostly on the cost of total theoretical value of the borrowed capital for the business-system. I will try to explain my concept by using the following scheme: Alexander Shemetev s001.jpg:880x92, 17k |
 Company's functioning scheme Alexander Shemetev s1.jpg:901x587, 221k |
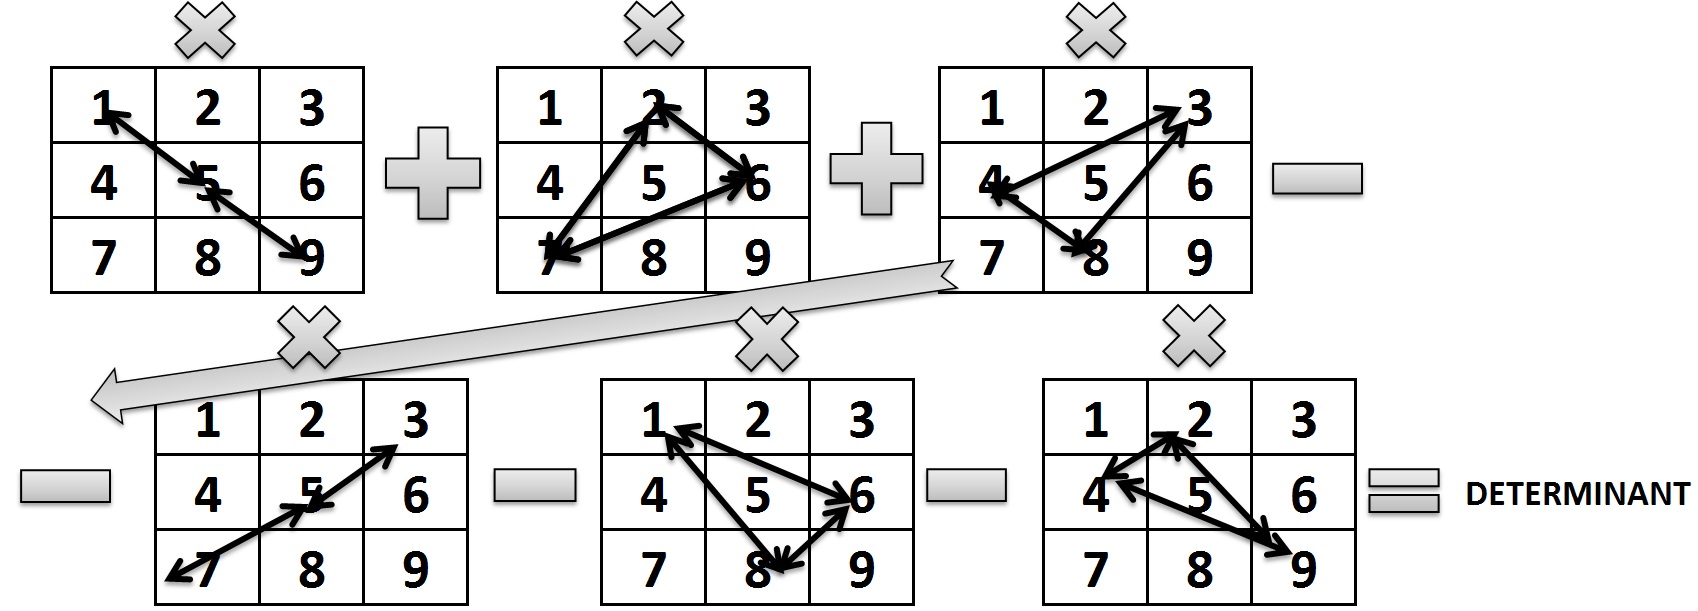 Scheme: Calculation of the determinant of the matrix system of indicators’ rapid analysis Alexander Shemetev s10.jpg:1698x611, 180k |
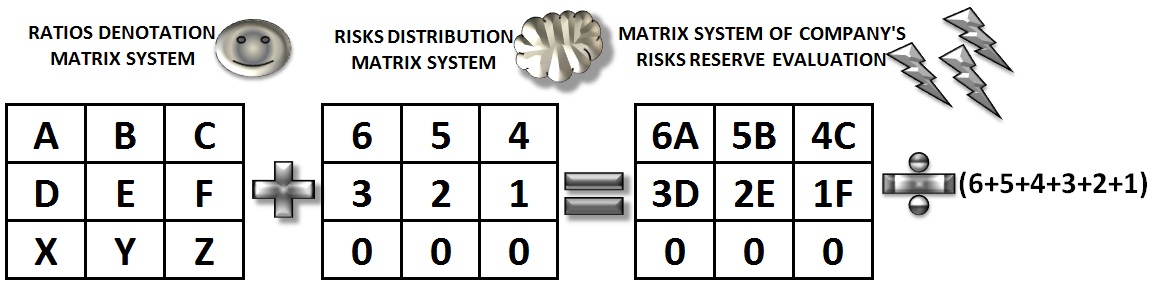 The model of this calculation is shown at the diagram below Alexander Shemetev s11.jpg:1162x283, 93k |
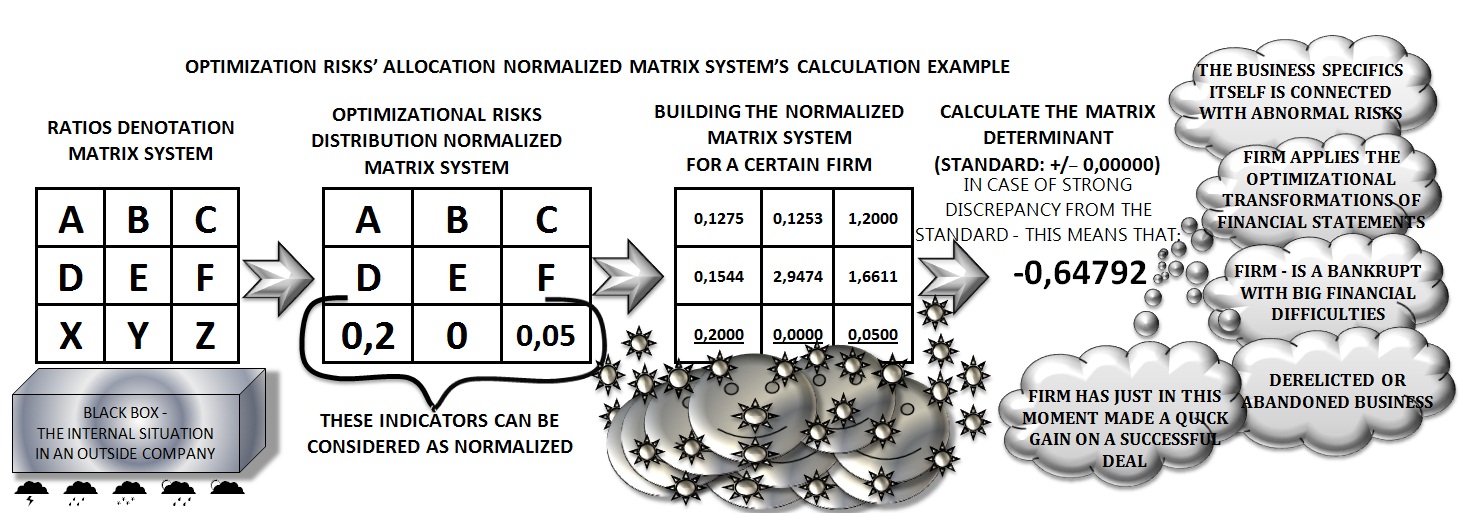 Optimization risks' allocation normalized matrix system's calculation example Alexander Shemetev s12.jpg:1463x513, 289k |
 Then you may compare these indicators with their average values. If the return is higher than the industry average, it probably makes sense to use these data. Alexander Shemetev s13.jpg:1260x690, 343k |
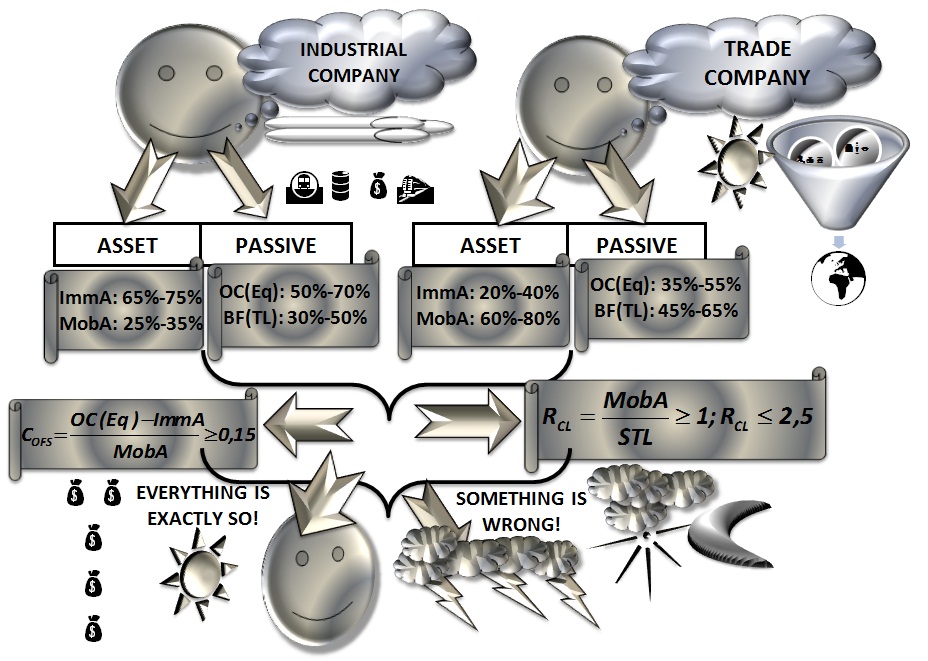 Scheme: rapid analysis following the model of ideal ratio of assets and liabilities Alexander Shemetev s14.jpg:928x661, 185k |
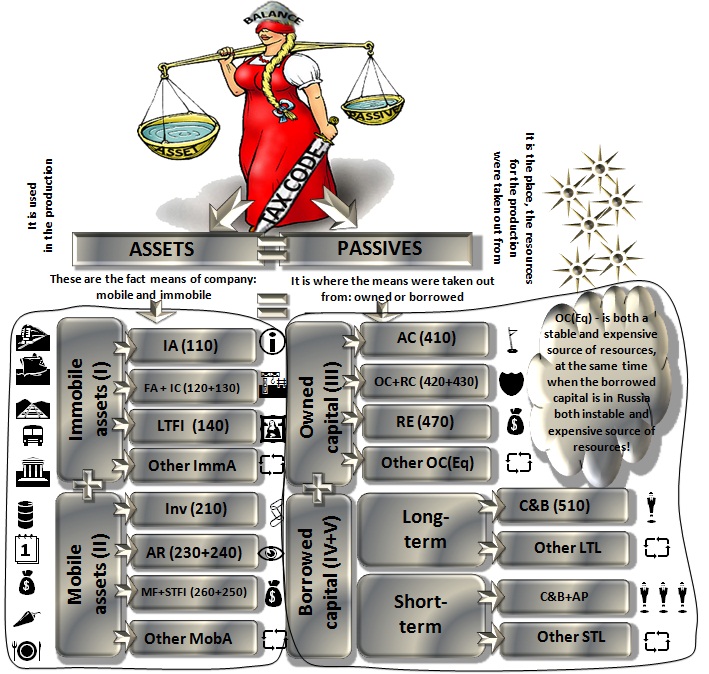 For beginning, let's look at the balance sheet, the basic document which serves as the basis for a classical complex financial analysis. Alexander Shemetev s15.jpg:709x674, 193k |
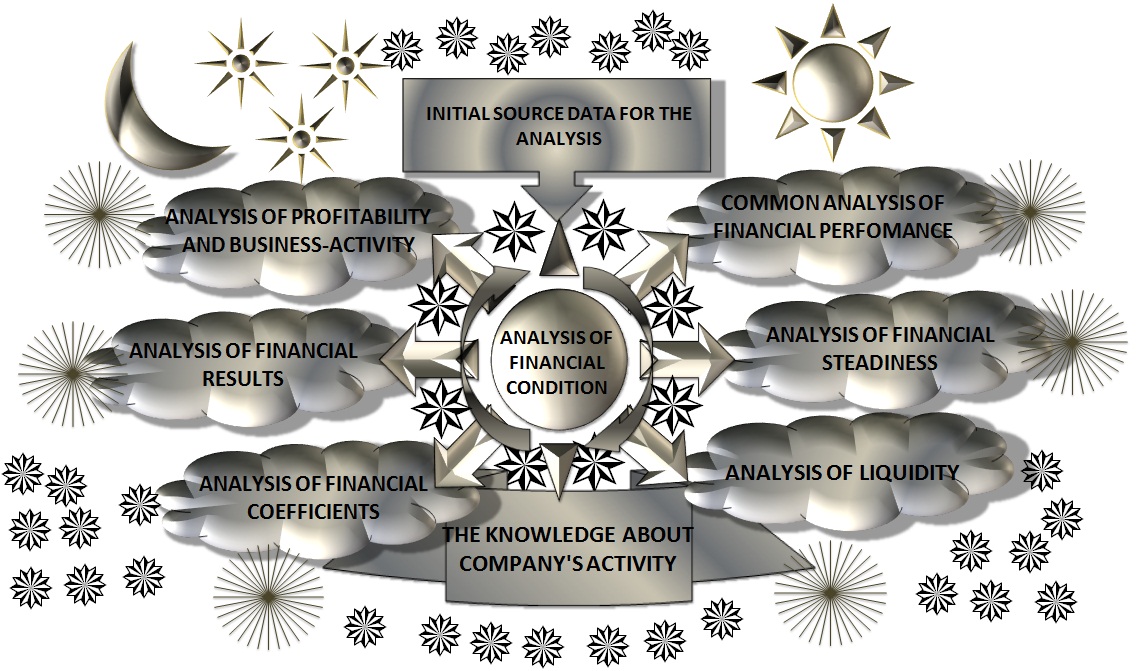 Scheme: a comprehensive financial analysis of business-systems Alexander Shemetev s16.jpg:1138x671, 273k |
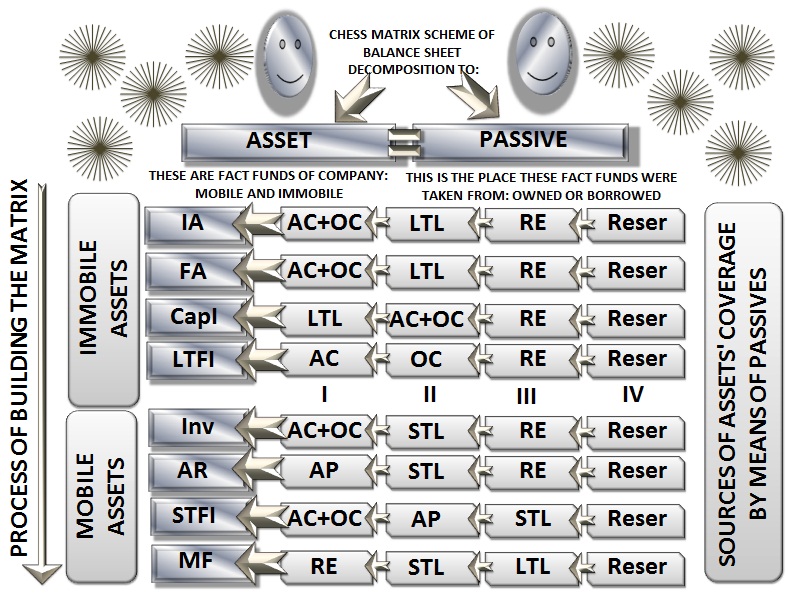 Scheme: Preparation of consolidated elements of the matrix (chess) balance analysis Alexander Shemetev s17.jpg:788x594, 210k |
 Company's functioning scheme Alexander Shemetev s3.jpg:624x448, 116k |
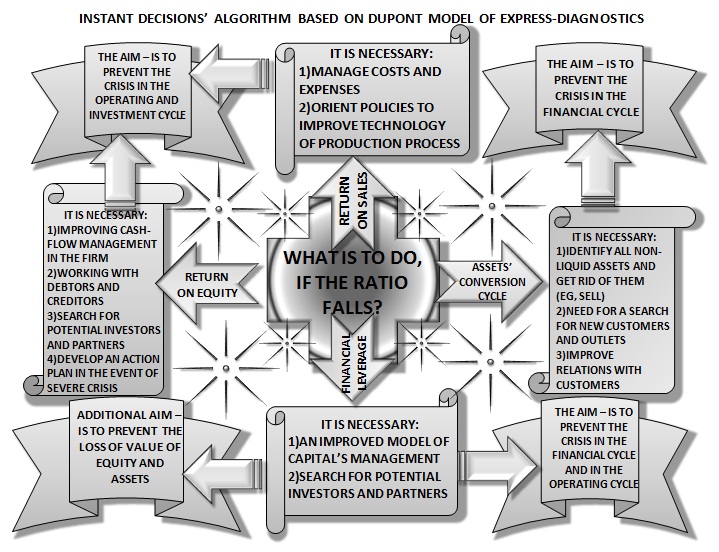 Now let's look at a small outline of what to do when the company’s functioning reveals problems based on our analysis of this model. Alexander Shemetev s4.jpg:719x552, 180k |
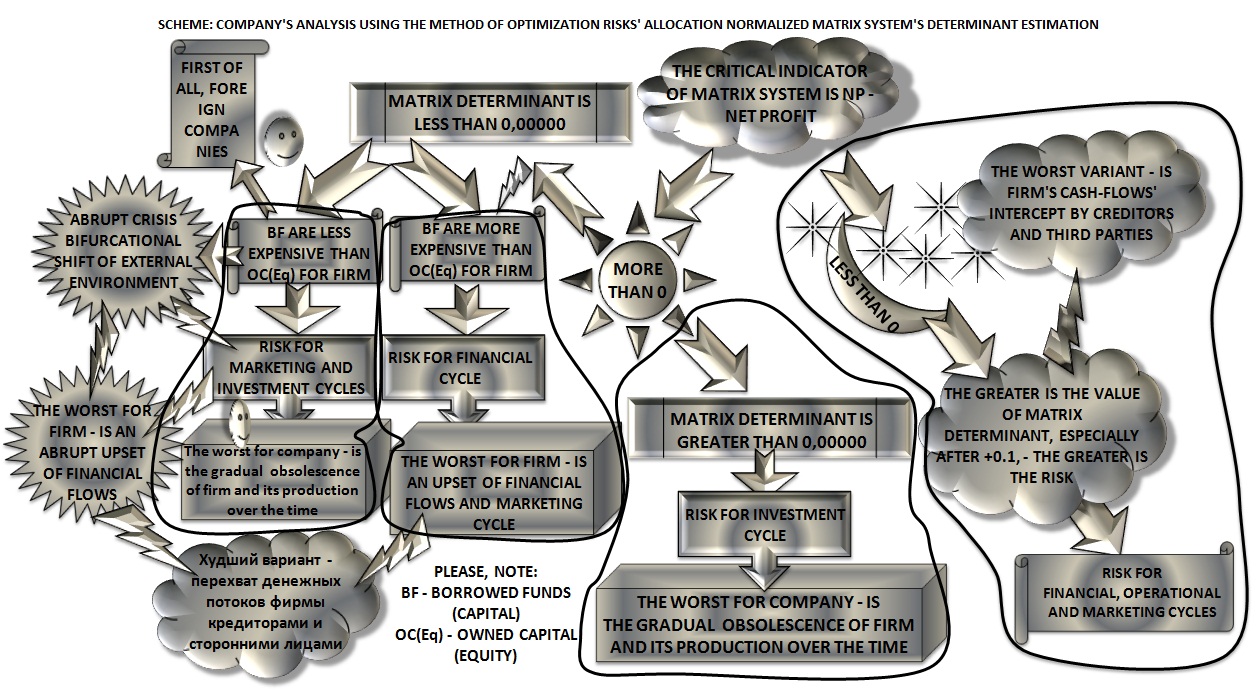
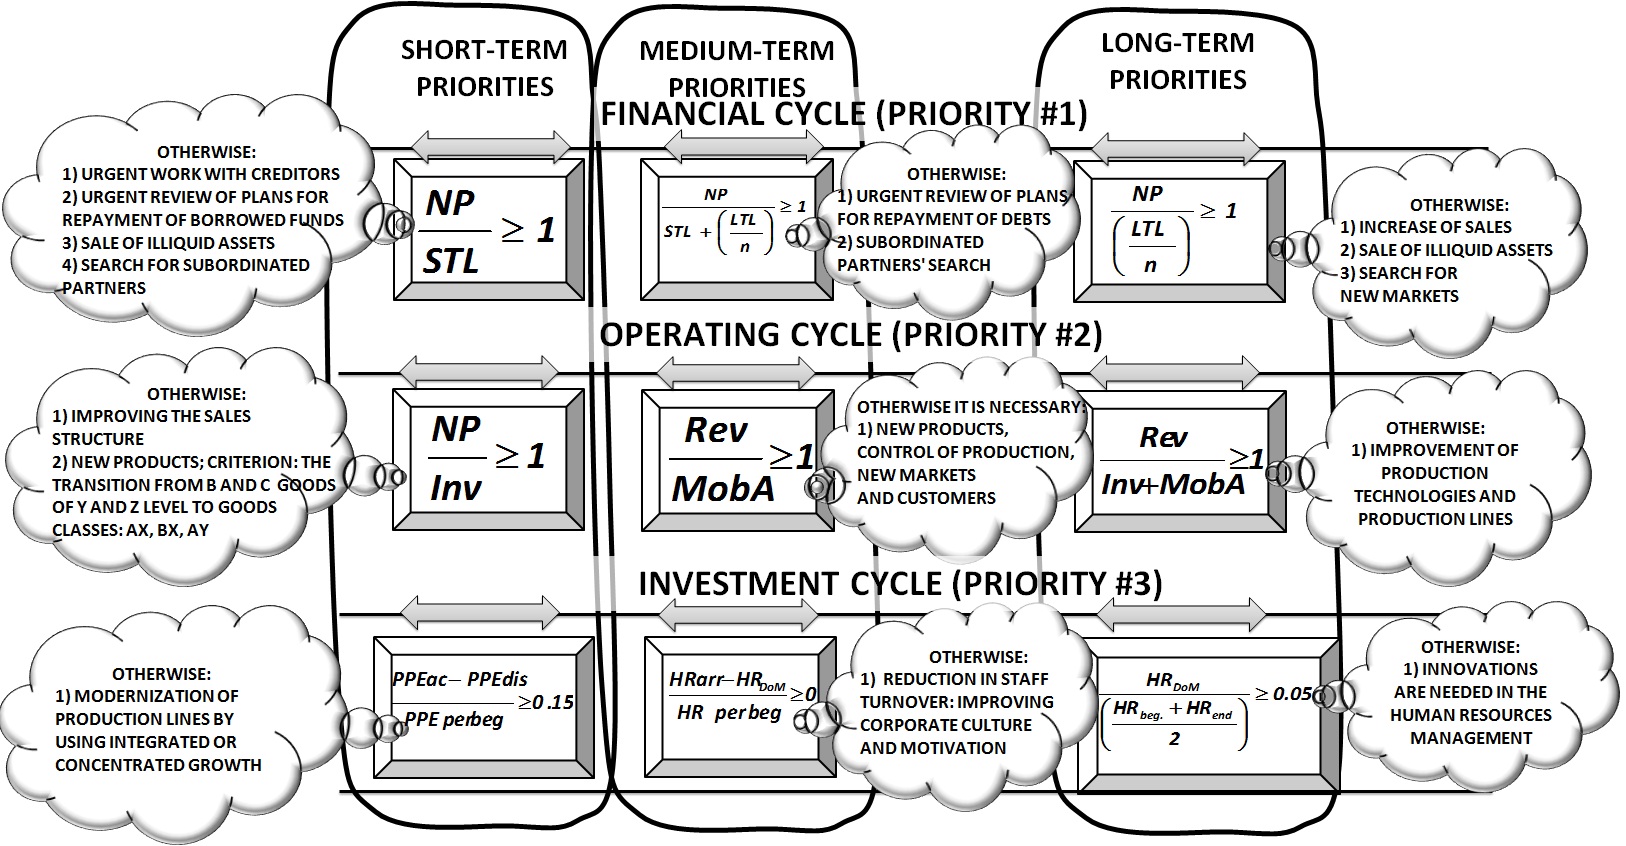 if you, my dear reader, is in an urgent need to find out which cycles of a single company have their problems and what are these problems – you can use the model, developed by Alexander Shemetev, to estimate this. Carefully read the following scheme to understand and remember the algorithm better: Alexander Shemetev s5.jpg:1626x846, 464k |
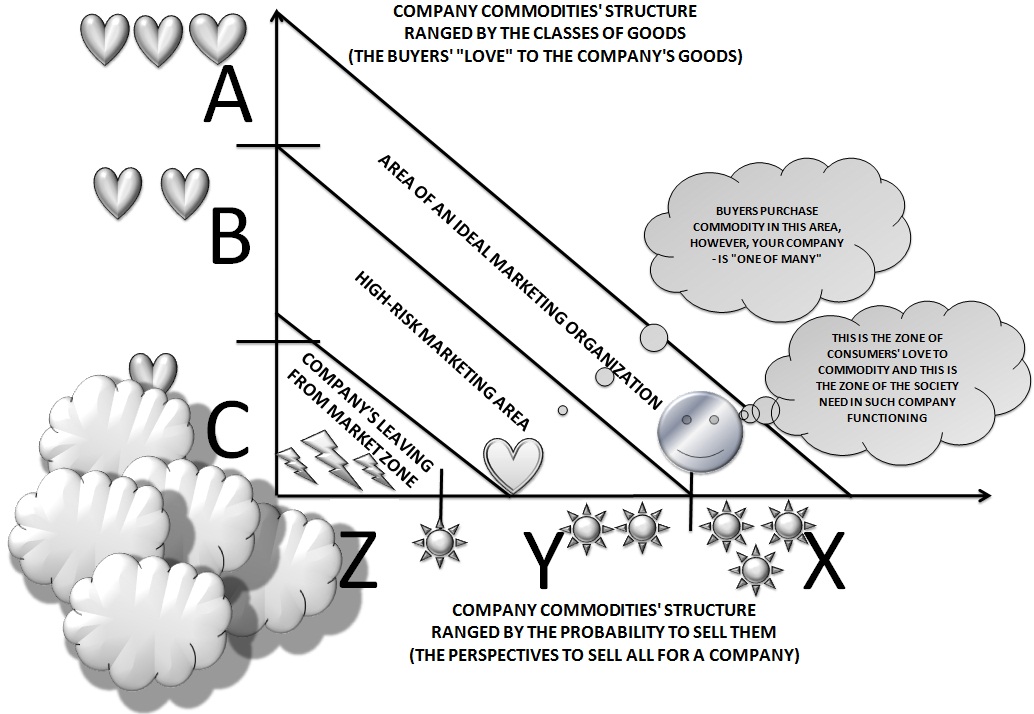 Scheme: Structure of the goods sold ranged by the class of goods linked with their perception by the consumer Alexander Shemetev s7.jpg:1034x714, 179k |
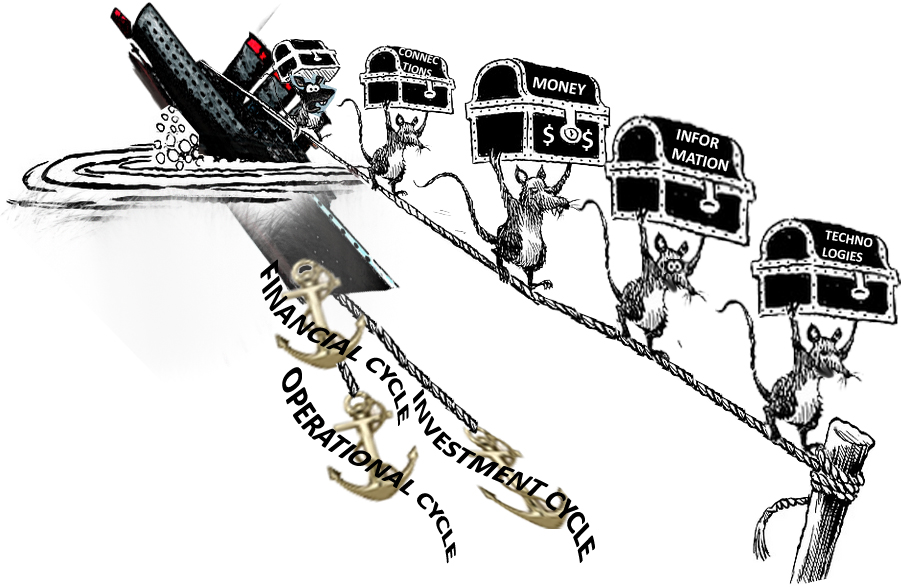
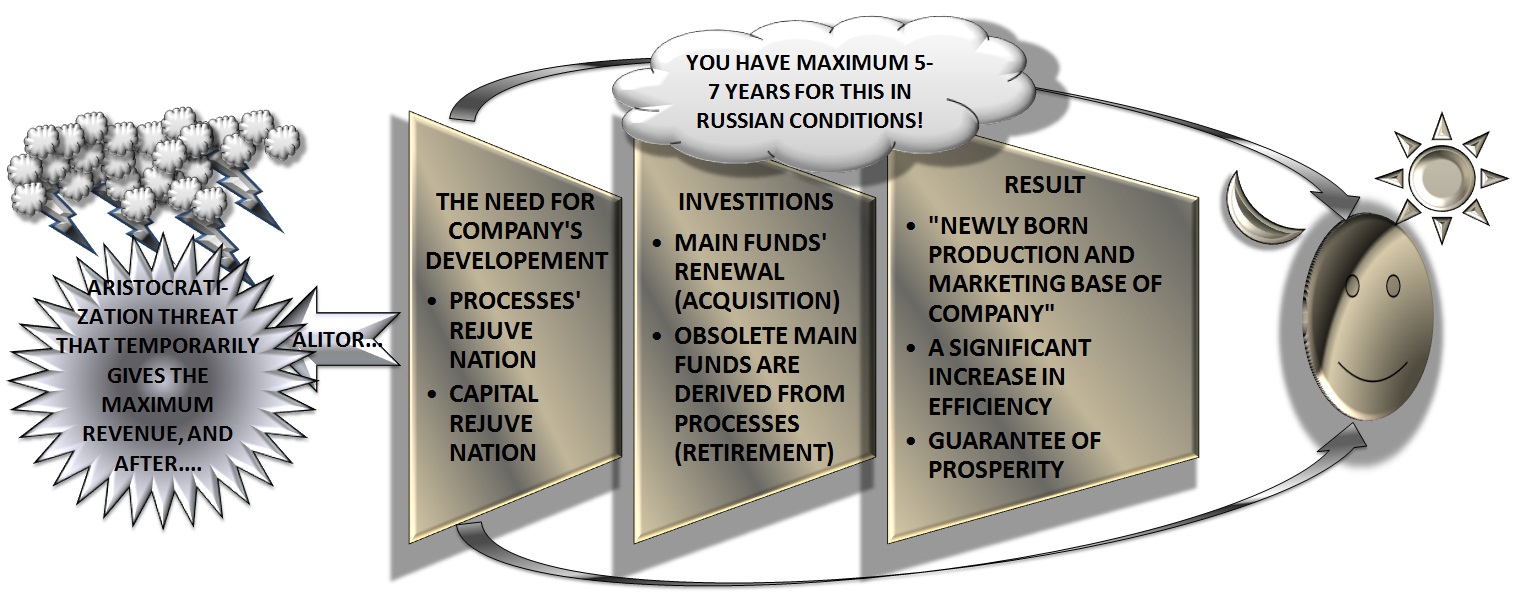 Scheme: investment cycle: how it transforms company and makes it more prosperous Alexander Shemetev s8.jpg:1523x595, 246k |
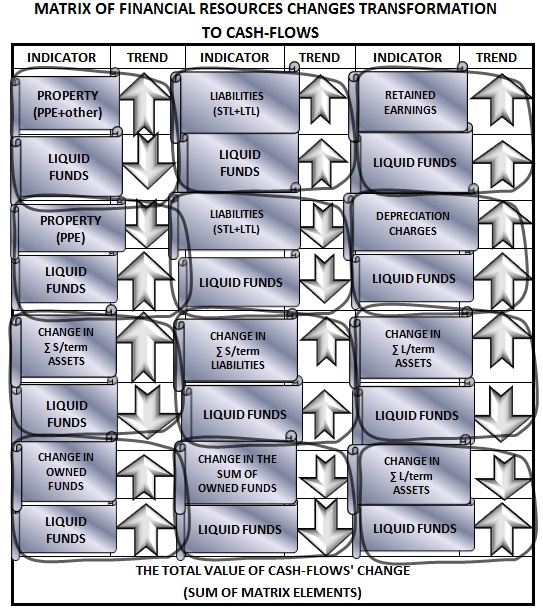 To ensure that you could easily segment the company's activities for cash flows, the author of this paper will offer you, my dear reader, the following scheme. Alexander Shemetev s9.jpg:543x609, 168k |
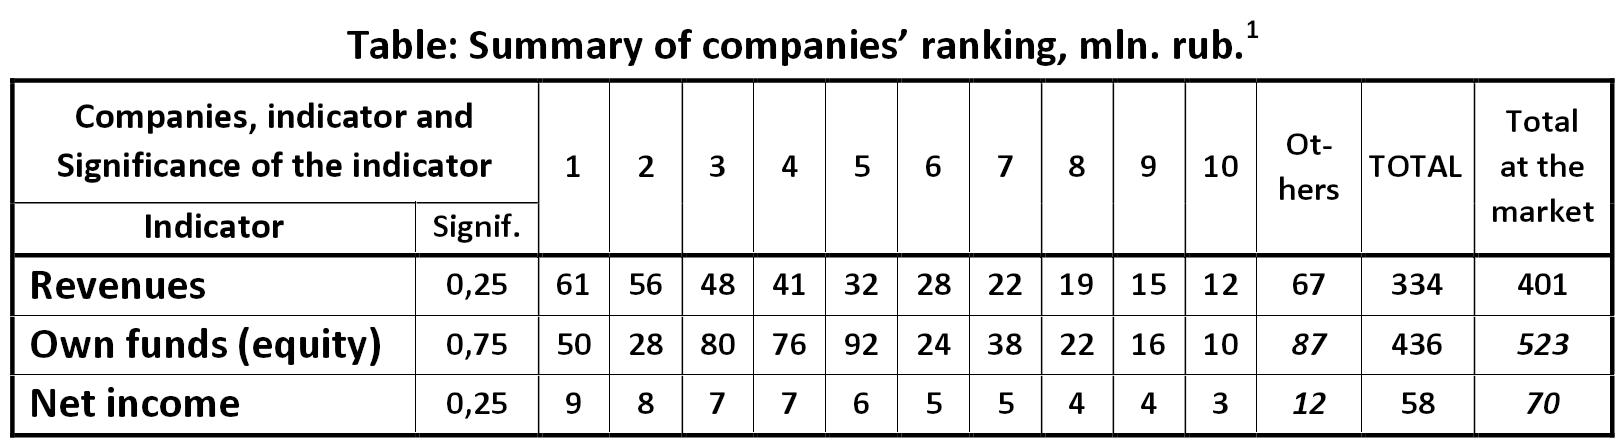 Table: Summary of companies’ ranking, mln. rub. Alexander Shemetev t1.jpg:1623x445, 103k |
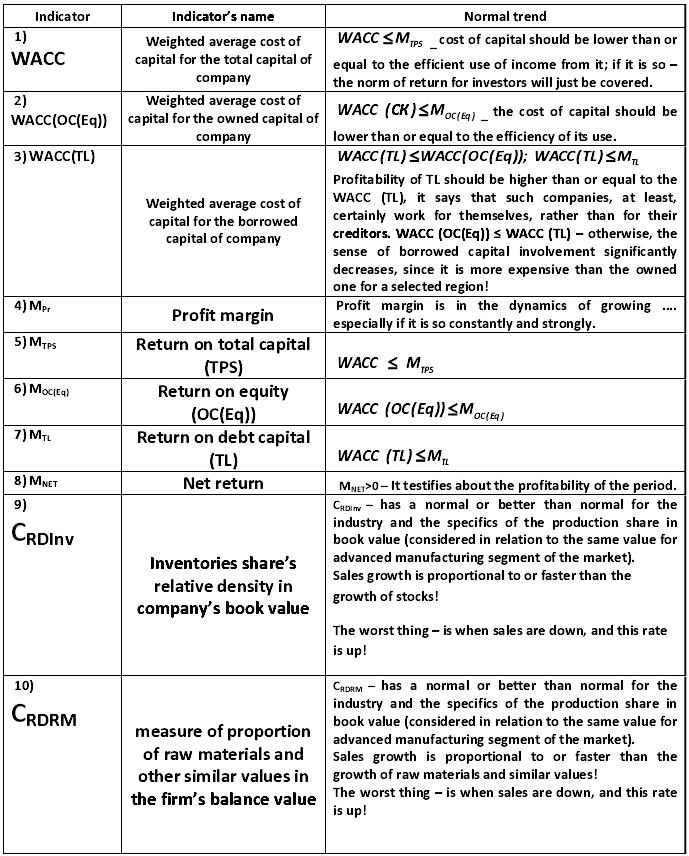 Table: Assessment of the financial stability of companies and the processes of hidden bankruptcy Alexander Shemetev t10.jpg:689x856, 144k |
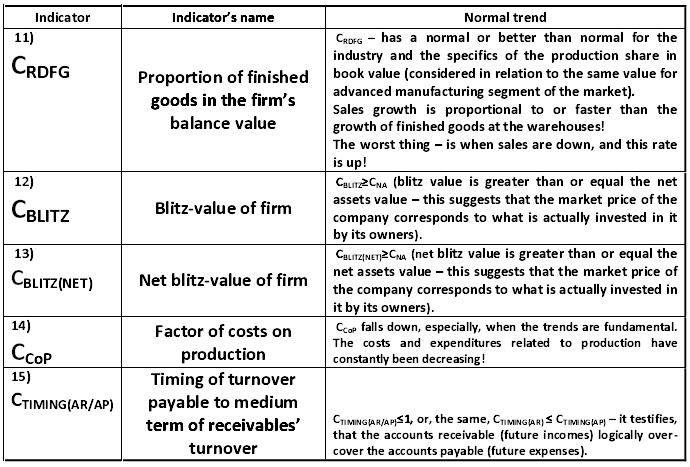 Table: Assessment of the financial stability of companies and the processes of hidden bankruptcy Alexander Shemetev t11.jpg:690x467, 87k |
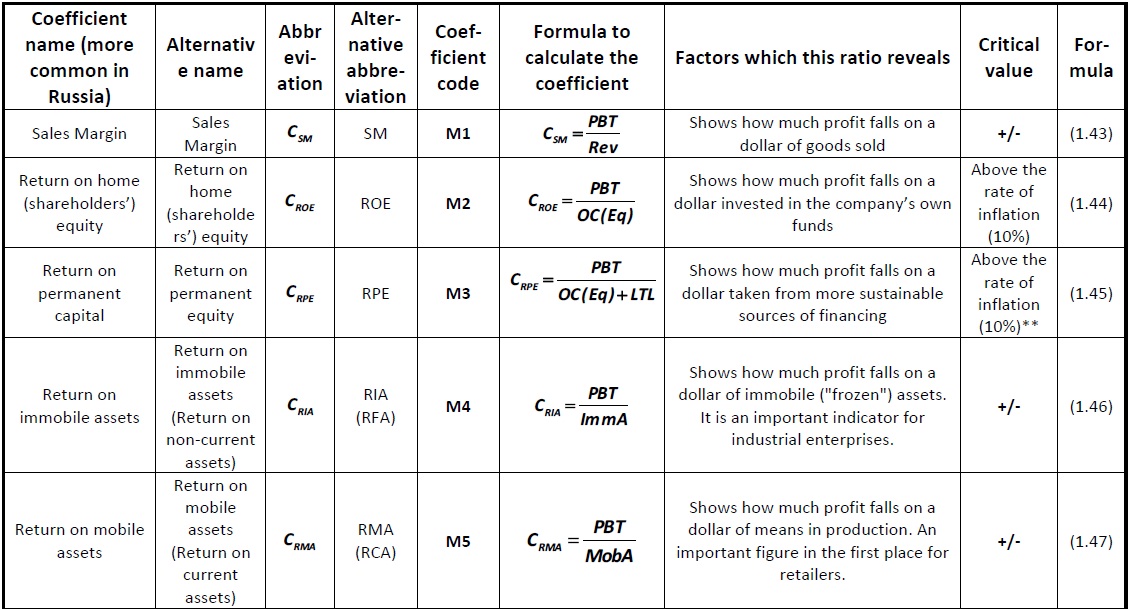
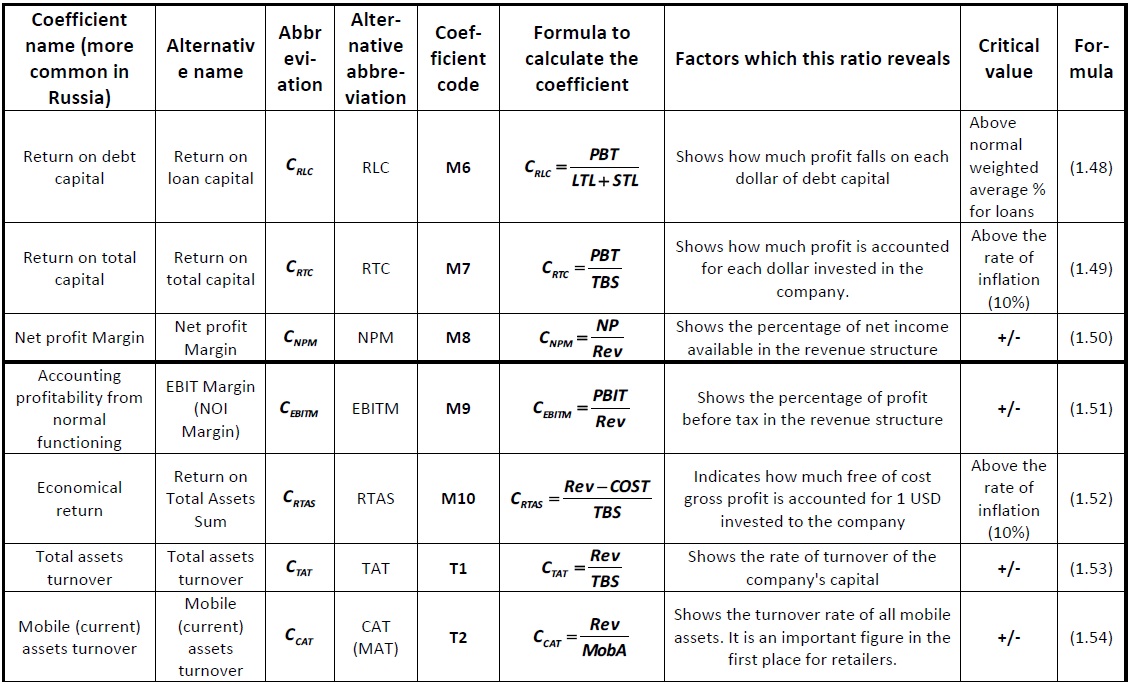
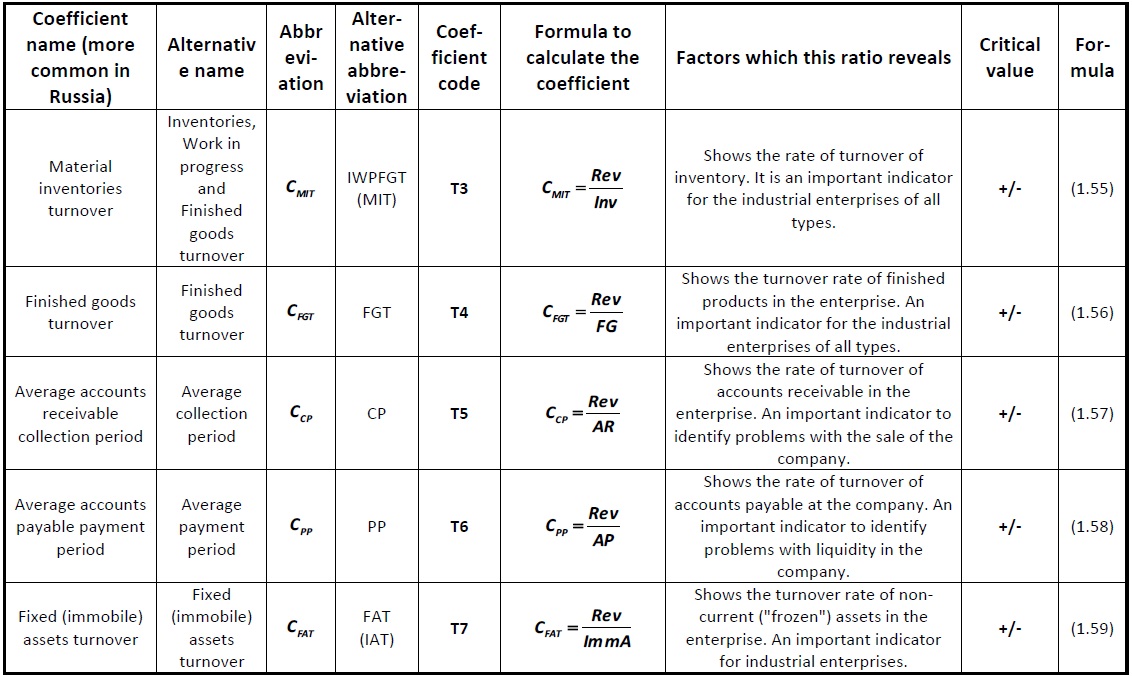
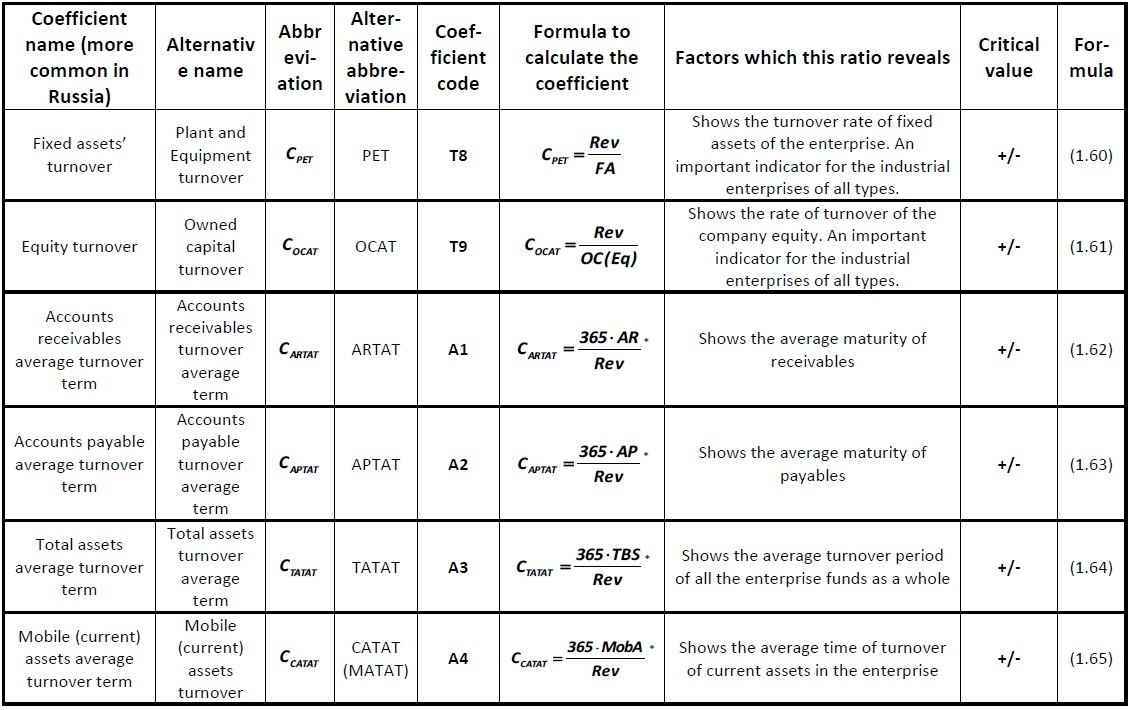
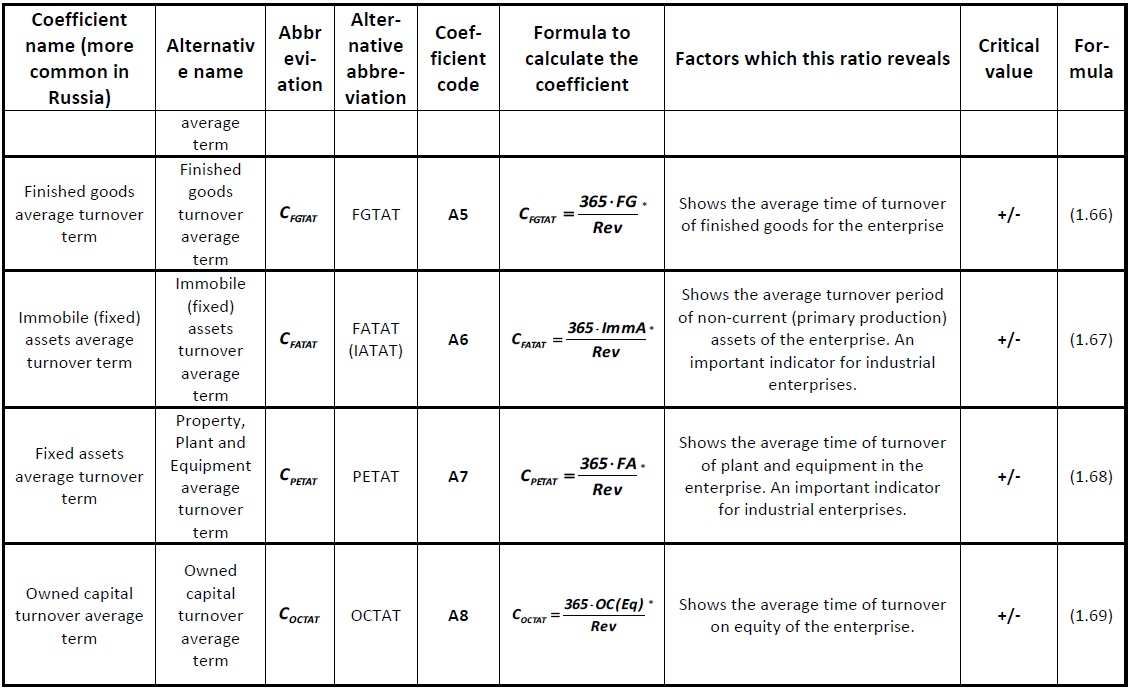
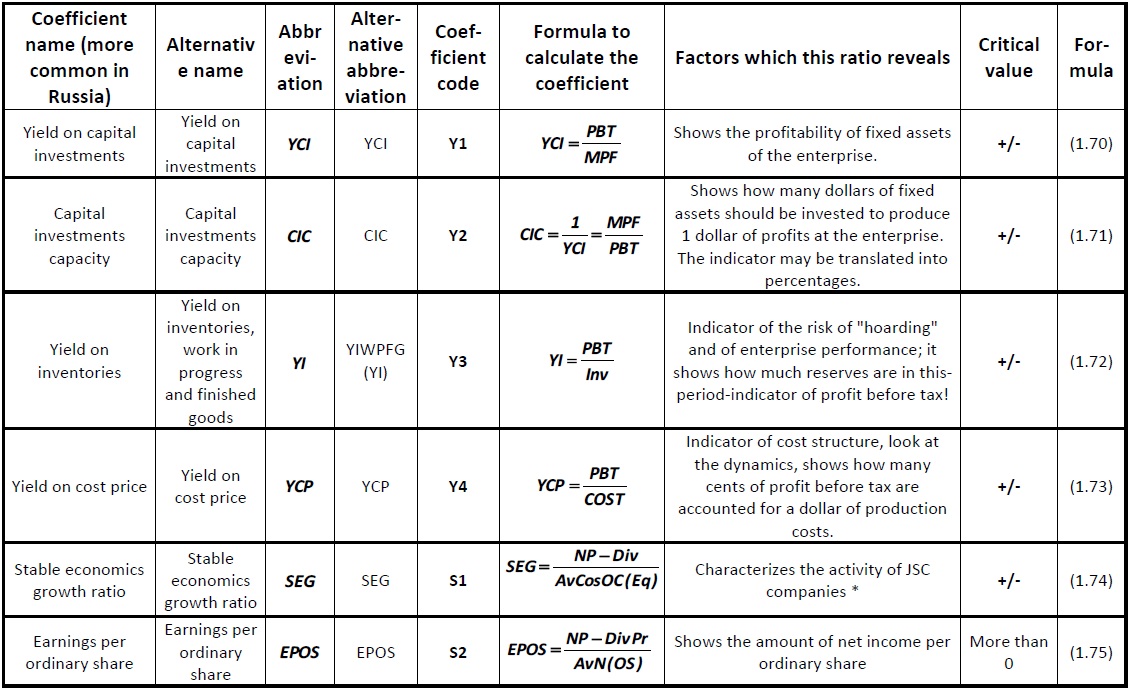
 The author of this paper created a table specially for you, dear reader, so you could easily understand this method. The table contains the ratios, their calculations and recommended values, as well as the short descriptions of these financial ratios: Alexander Shemetev t12.jpg:1400x470, 66k |
 The author of this paper created a table specially for you, dear reader, so you could easily understand this method. The table contains the ratios, their calculations and recommended values, as well as the short descriptions of these financial ratios: Alexander Shemetev t13.jpg:876x876, 122k |
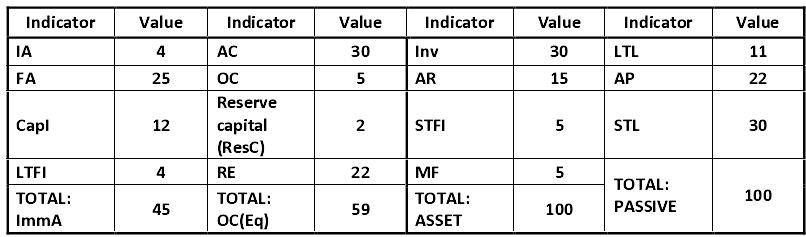 Table: Data from Company "Good Luck" on 01.01.2011, million USD Alexander Shemetev t14.jpg:806x237, 37k |
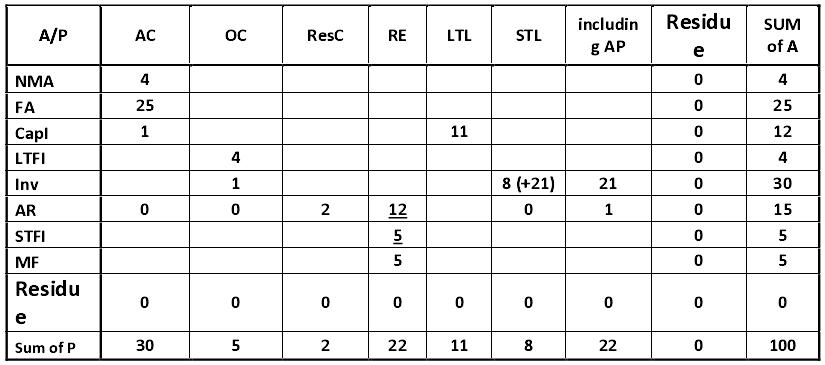 Table: Chess-balance matrix of Company "Good Luck" at the beginning of the reporting period, millions USD Alexander Shemetev t15.jpg:825x365, 49k |
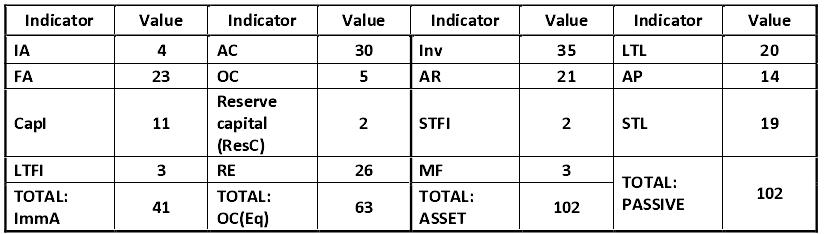 Table: Data of Company "Good Luck" on 01.01.2012, millions of USD Alexander Shemetev t16.jpg:824x234, 38k |
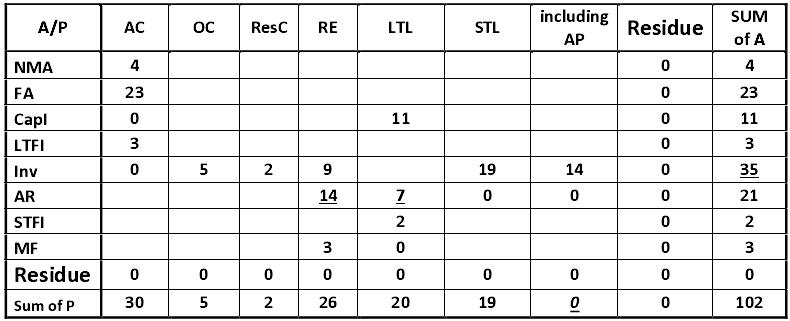 Table: Chess-balance-matrix of Company "Good Luck" at end of period, millions of USD Alexander Shemetev t17.jpg:790x321, 46k |
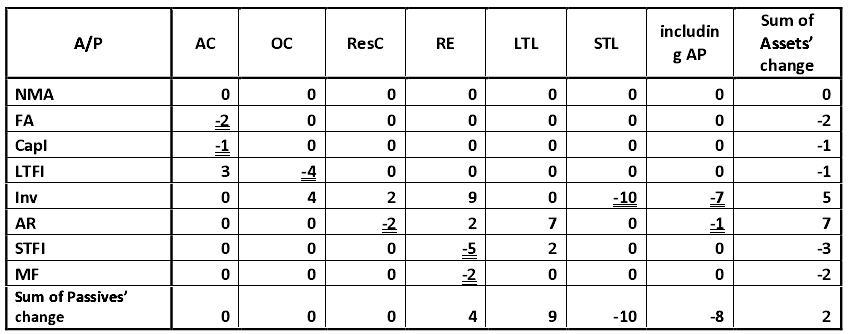 Table: Analytic matrix chess-balance of Company "Good Luck"at end of period, millions of USD Alexander Shemetev t18.jpg:849x334, 49k |
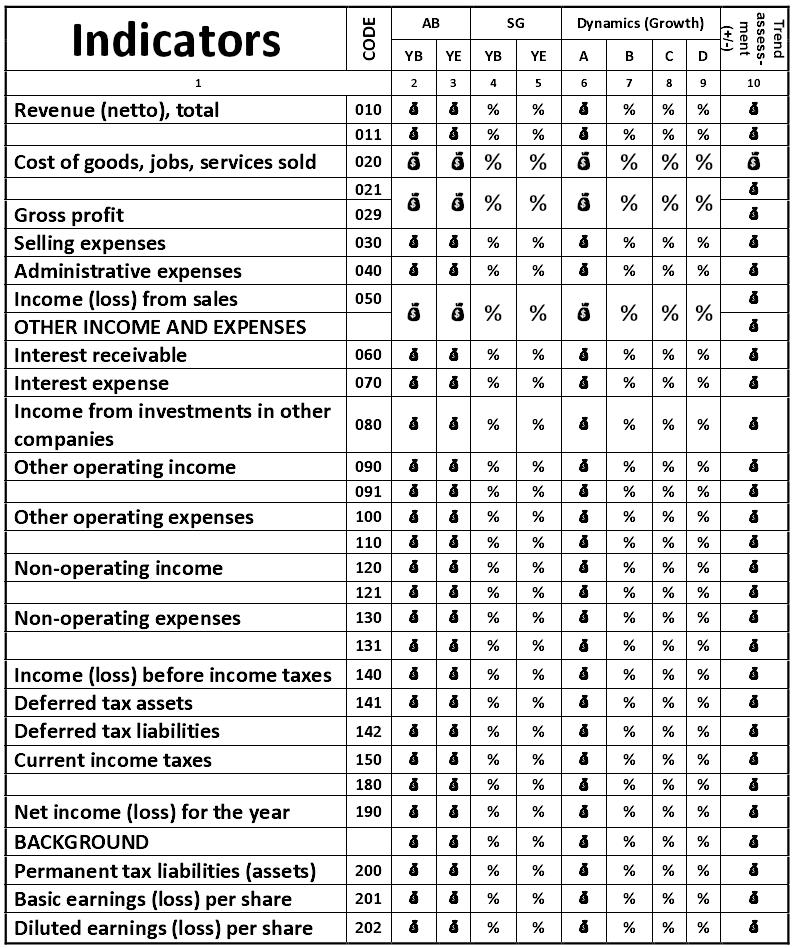 Table: Analysis of the dynamics of the profits Alexander Shemetev t19.jpg:792x948, 194k |
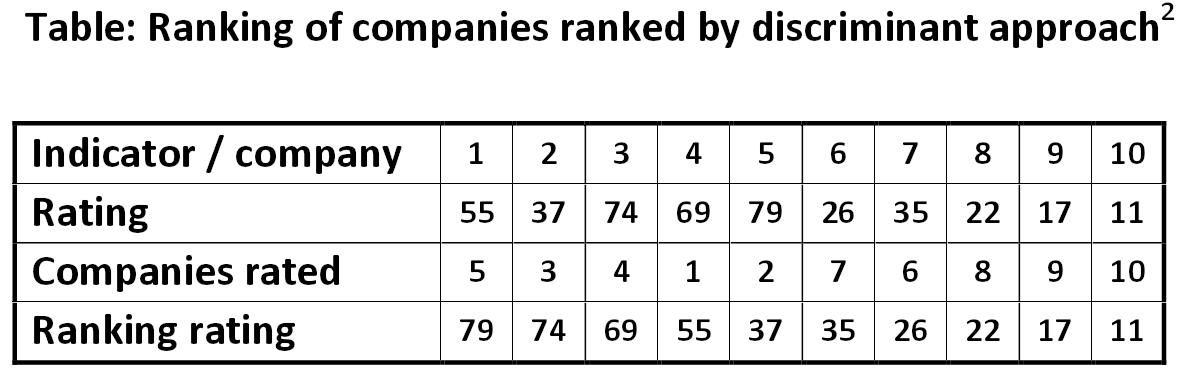 Table: Ranking of companies ranked by discriminant approach Alexander Shemetev t2.jpg:1178x373, 65k |
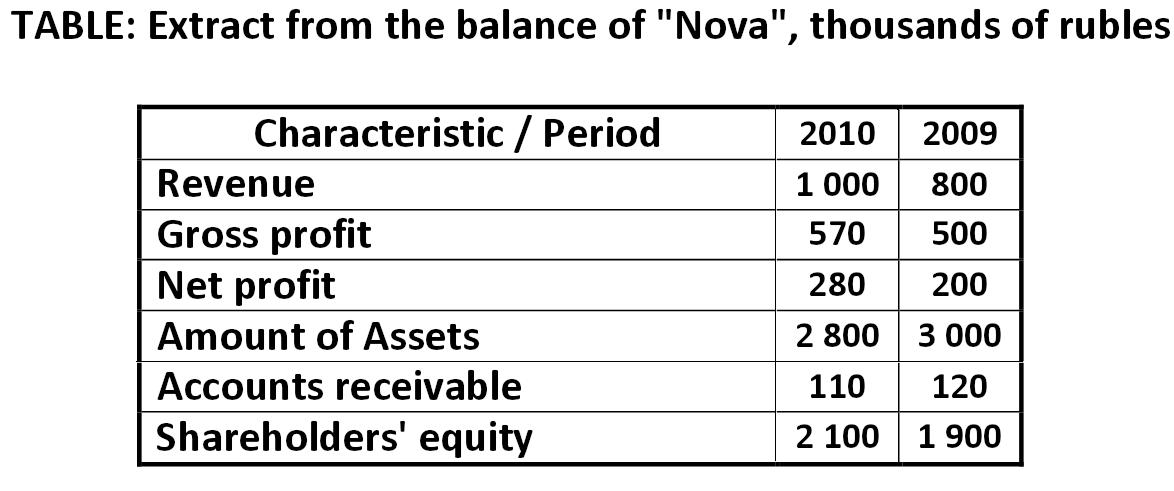 TABLE: Extract from the balance of "Nova", thousands of rubles Alexander Shemetev t3.jpg:1174x491, 77k |
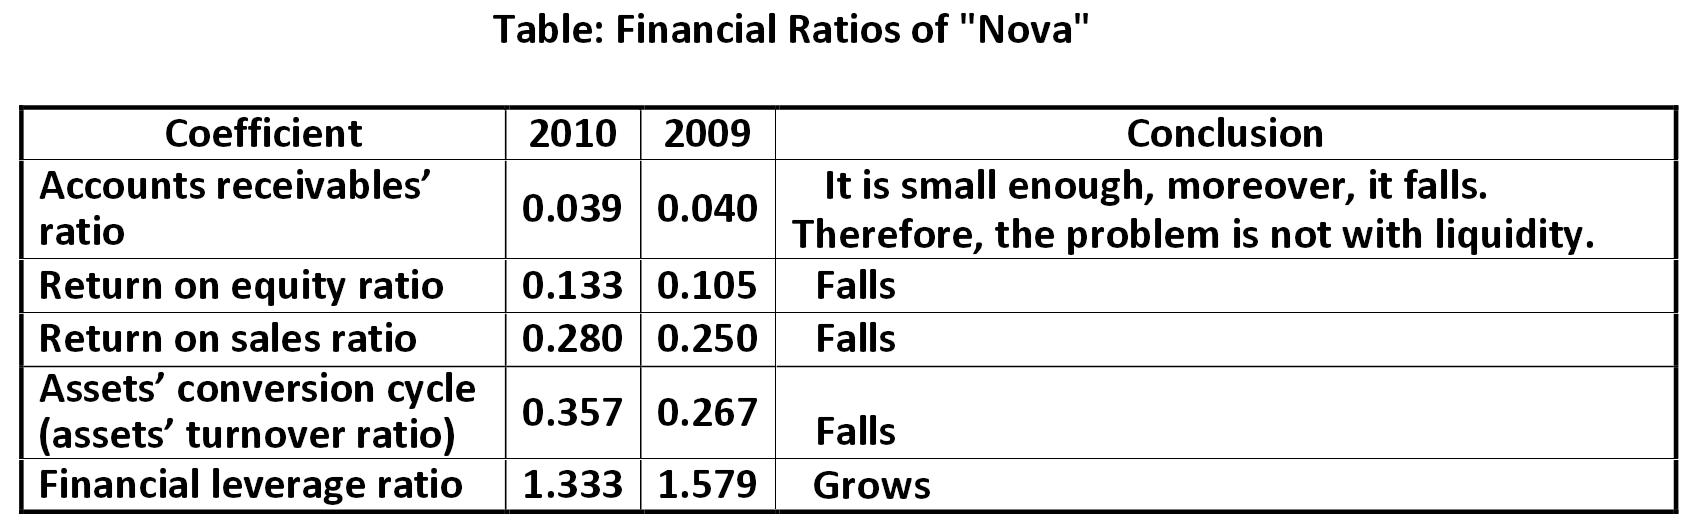 Table: Financial Ratios of "Nova" Alexander Shemetev t4.jpg:1688x520, 123k |
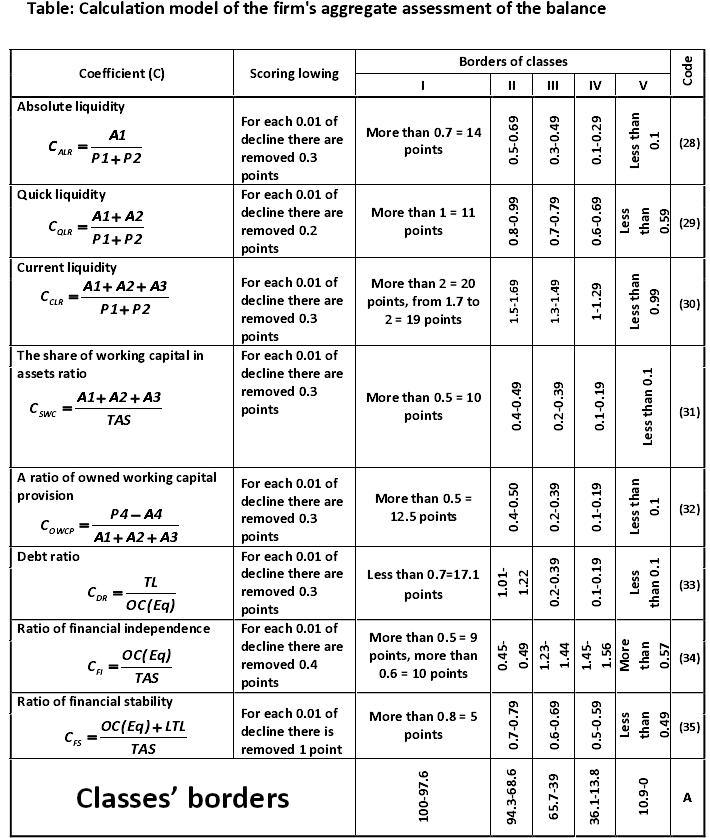 Table: Calculation model of the firm's aggregate assessment of the balance Alexander Shemetev t5.jpg:710x838, 124k |
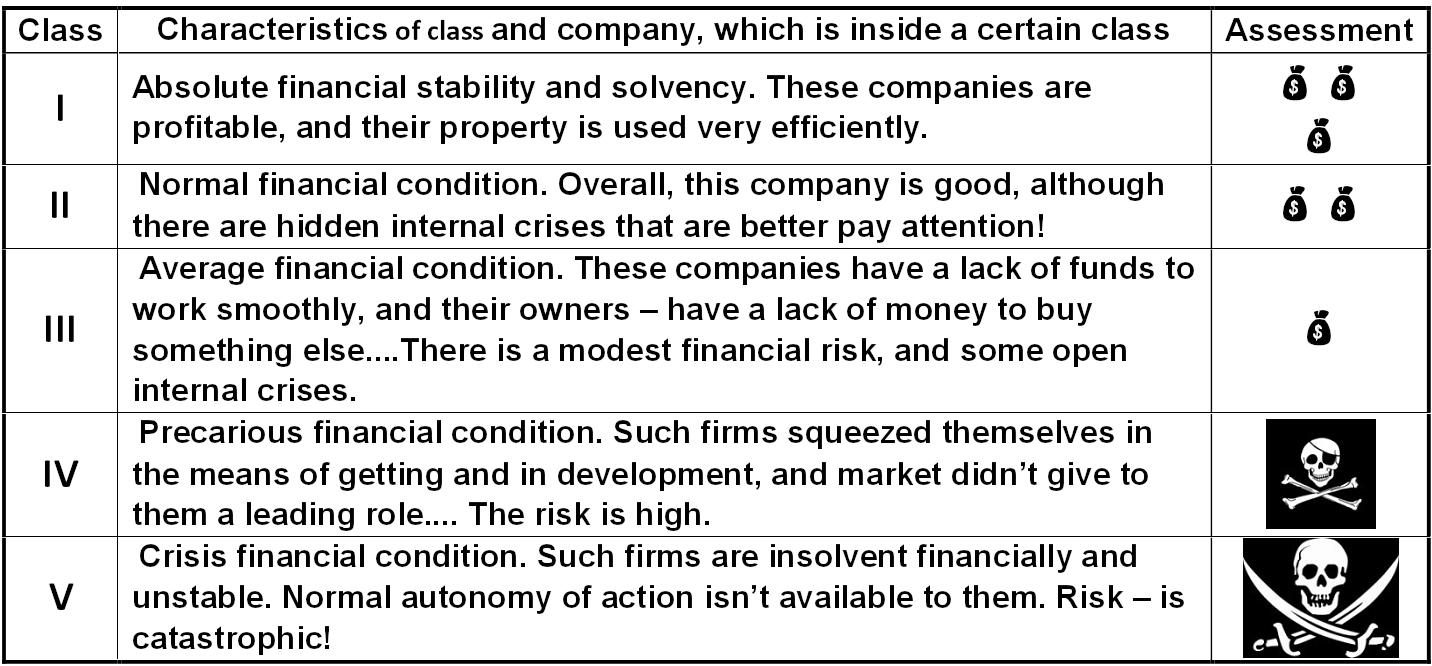 Table: A unified characteristics of the firm according to model 2.1 Alexander Shemetev t6.jpg:1432x666, 189k |
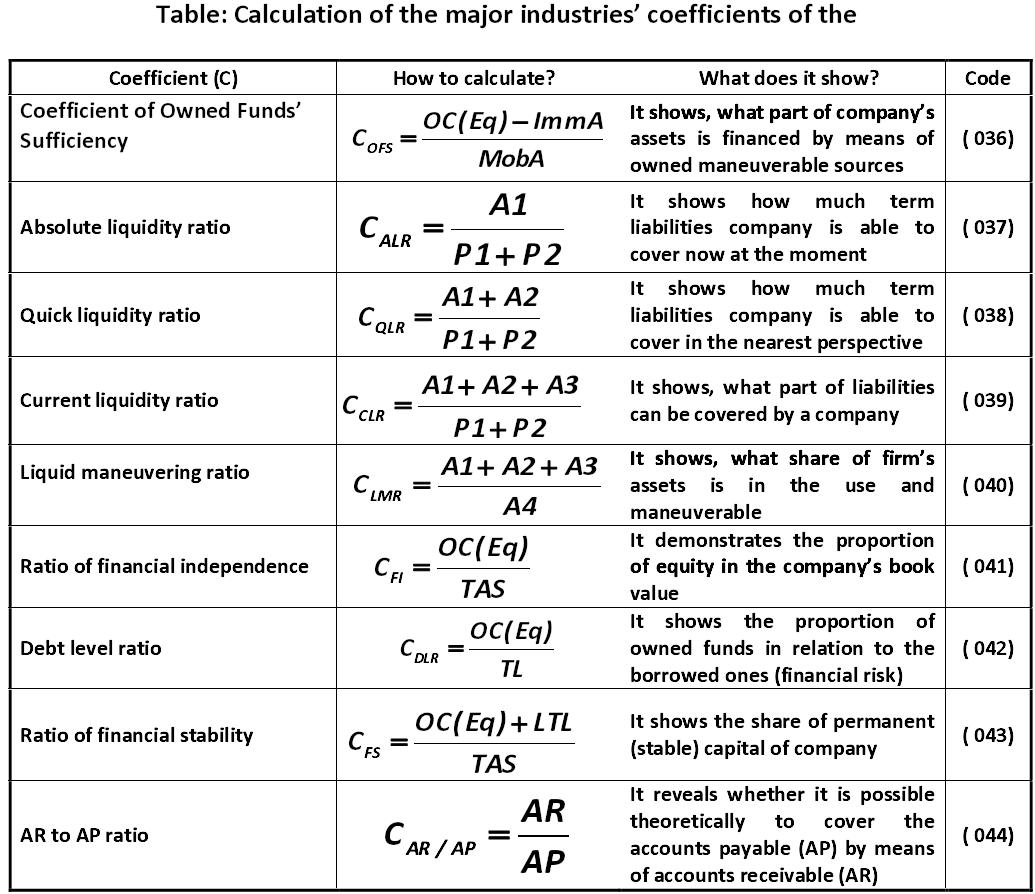 Table: Calculation of the major industries’ coefficients of the financial analysis Alexander Shemetev t7.jpg:1035x894, 169k |
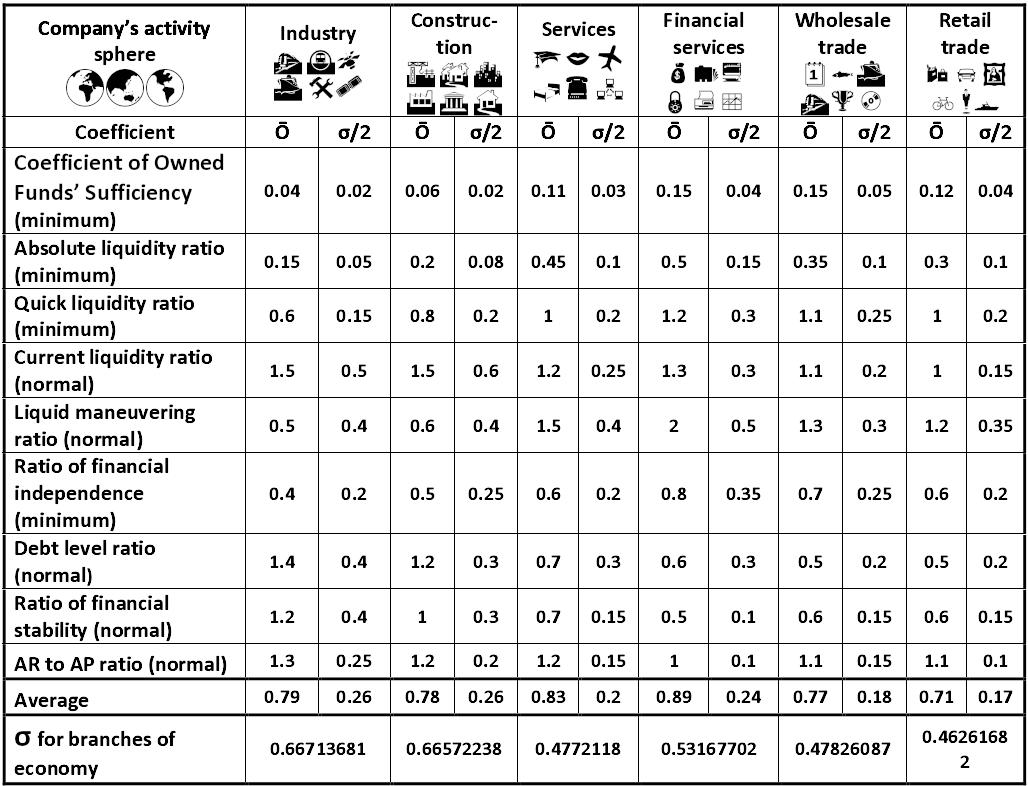 Table: The basic norms of the coefficients of the main branches of economy Alexander Shemetev t8.jpg:1028x786, 164k |
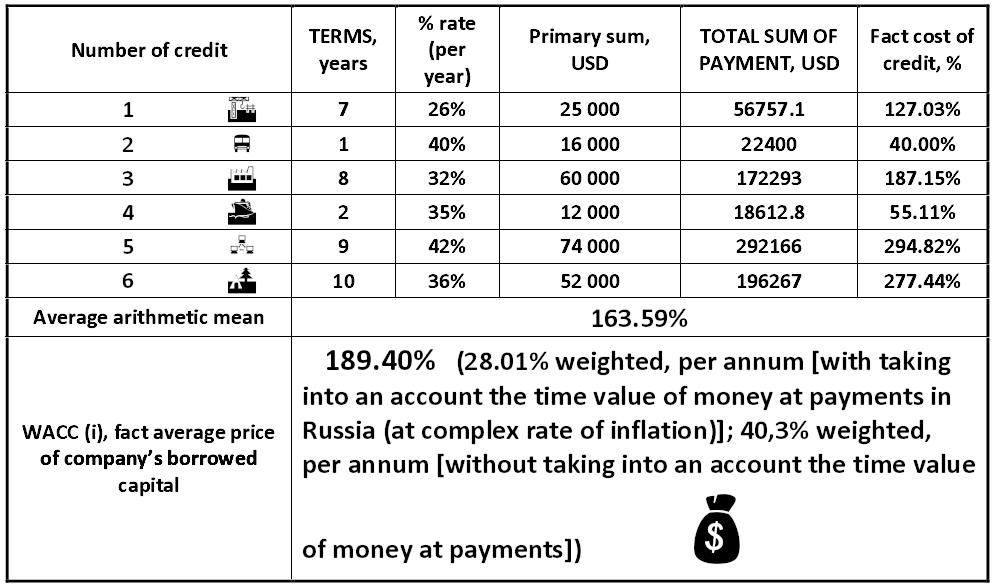 Table: Actual interest rates on loans Alexander Shemetev t9.jpg:993x586, 105k |
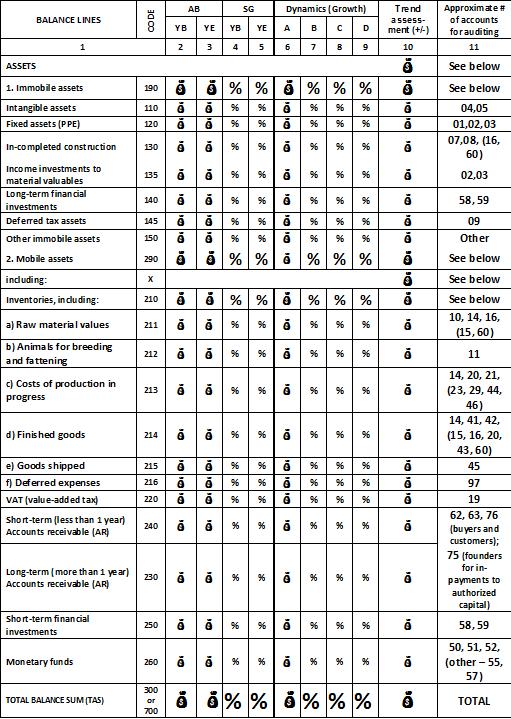 Table schema: Overview of the financial condition of a business-system Alexander Shemetev ts1.jpg:511x719, 106k |
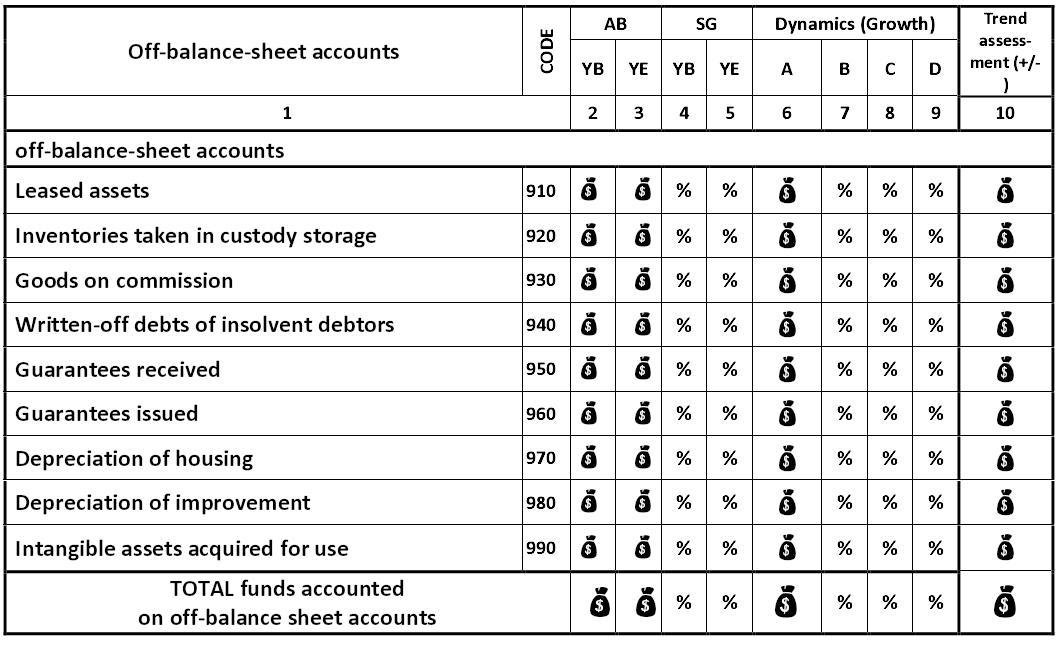 Table: Total financial analysis for off-balance accounts Alexander Shemetev ts2.jpg:1064x648, 122k |
|
X average xav.jpg:34x39, 0k |