Шеметев Александр Александрович : другие произведения.

Alexander Shemetev Section I. A comprehensive financial analysis of Russian companies on financial and economic indicators and their systematization: Alexander Shemetev"s models

Самиздат: [Регистрация] [Найти] [Рейтинги] [Обсуждения] [Новинки] [Обзоры] [Помощь|Техвопросы]
Ссылки:


 Ваша оценка:
  • Аннотация:
    Abstract: The paper is devoted to the comprehensive financial analysis. Much attention is paid to its providing in the Russian context. Alexander Shemetev, the author of this paper, provides a series of methods and models developed by him like: rapid matrix analysis of financial, operational-marketing and investment cycles functioning inside companies; models of comprehensive analysis of financial stability; method for weighted average cost of debt capital estimation; method company"s financial analysis based on payback period term analysis; comprehensive liquidity analysis ratios - these are the described here complex methods developed by Alexander Shemetev. Also Alexander Shemetev describes the other concepts of comprehensive financial analysis and its elements in a simple form so that a wide audience of readers could easily understand the materials of this paper. It is also described how to analyze Russian companies in the Russian context through the prism of optimization transformations of financial statements. All the necessary financial ratios are represented in complex matrix systems by the author. All the difficult aspects of financial analysis are explained in simple schemes.


  Alexander Shemetev (copyright protection),
  
  
  Saint-Petersburg
  For further questions, please, contact me at:
  Anticrisis2010@mail.ru
  
  Alexander Shemetev's photo [Alexander Shemetev]
  
  Abstract: The paper is devoted to the comprehensive financial analysis. Much attention is paid to its providing in the Russian context.
  Alexander Shemetev, the author of this paper, provides a series of methods and models developed by him like: rapid matrix analysis of financial, operational-marketing and investment cycles functioning inside companies; models of comprehensive analysis of financial stability; method for weighted average cost of debt capital estimation; method company"s financial analysis based on payback period term analysis; comprehensive liquidity analysis ratios - these are the described here complex methods developed by Alexander Shemetev.
  Also Alexander Shemetev describes the other concepts of comprehensive financial analysis and its elements in a simple form so that a wide audience of readers could easily understand the materials of this paper. It is also described how to analyze Russian companies in the Russian context through the prism of optimization transformations of financial statements. All the necessary financial ratios are represented in complex matrix systems by the author. All the difficult aspects of financial analysis are explained in simple schemes.
  
  Keywords: comprehensive financial analysis; rating analysis; rapid analysis; common financial analysis; WACC analysis; financial sustainability analysis; financial ratios analysis; liquidity analysis; financial results analysis; financial efficiency analysis; business profitability and business-activity analysis; Alexander Shemetev"s models for financial analysis.
  Section I. A comprehensive financial analysis of Russian companies on financial and economic indicators and their systematization: Alexander Shemetev"s models
  
  
  A comprehensive financial analysis in Russia - is a relatively new concept. 15-20 years ago, under this analysis was understood primarily an economic analysis. Today, the topic is growing rapidly. A comprehensive financial analysis should help all directors and owners of companies to make their work more effective. It's no secret, that the state of affairs in a company is not transparent for senior management. And what if it comes not on its own, but about somebody else"s other company? People have adopted the practice in Russia to bifurcate or even sometimes to trifurcate (from the word "three") the reporting of company"s activities, sharing, by thus, managerial accounting, financial accounting and just accounting (for the concerned "legislative" (read: "tax") bodies). In this situation, rating the company from a position of a third party is difficult, and it similar to how when we try to see what is inside of some office space on the first floor where the entrance is closed, where there are no signs, except Company Limited "New Time", and where even the windows are mirrors - so nothing can be seen behind them .... Thus, the financial analysis of the company - this is not the easiest thing .... And it is the basis of any strategy and any company activities.
  Dear reader, please, consider: how you can manage a company without knowing the exact state of affairs inside? How can you build a development plan on the market, if you do not know the state of competition?
  In this chapter the author describes an integrated analysis algorithm of the company. And then you and I let us to investigate the details: we will conduct a comprehensive financial analysis of various aspects in a firm, such as marketing, management, risks, and so on. Financial analysis - is not a "magic wand" that will allow you to develop a strategy for your company simply by waving your hand. Financial analysis - it is rather a tool. And, like any tool, it will work just as much as much skills you will be able to use, and it will depend on how well you use them! And if you do not use it - then it will be done, and, probably, already is done by your competitors who will then take an advantage in the foreseeable future to push your company down to the "roadside" of the market occupied by your company. And then you will, probably, all have to start again .... Restarting the business from naught or, and that is much worse, from big debts is neither fun, nor "cheap", especially in Russia. You will have to Re-search for money, Re-search for capital .... At the same time you will need to develop a new business idea .... You will need to Find a qualified personnel .... That, in fact, is very difficult .... Then you will have to look for customer base and over and over again to fight with the competition..... Isn"t it simpler to keep the market from the very beginning, so that your company is to be "entrenched" in it forever? Isn"t it simpler to make your company sufficient it could be useful for you and your children and your grandchildren and so on?
  You will be hard to keep the capital with no financial analysis, and it doesn"t matter how successful is your company now at the moment. You should remember that about 30 years ago the world lost one of the biggest investment network, which was run under the commandment of one of the richest people in the world, Mr. Adnan Khashoggi, a citizen of Saudi Arabia and a number of countries. His cartel developed itself rapidly in his time: he had the usual practice of personal selling of any goods at retail, when he, a mining engineer by education, once decided to do business in earnest, and he did.... Within the next 20 years he owned the factories, steamships, oil derricks, auto concerns (even such societies as Rolls Royce, Fiat, Chrysler, and so on depended on him much....), ...... And also he was suspected in the possession of the world's major shadow networks owner, including the network of wholesale selling the weapons....
  Before to divorce his wife, Thoraya, which required him to pay her $ 2.5 billion in compensation for their marriage, he was considered by many global ratings as one of the richest person on the planet, with the capital, according to unofficial data, surpassed $ 70 billion (this is in the early 1980s, and it was approximately the same as to possess now $ 200 billion). He did not have a proper financial analysis, and he did not do it in the complex, and his business began to be pursued by a set of setbacks. By the early 90s, he almost became a real "multi-billionaire in minus", this is when a person has a wealth over a billion dollars, and it is with a minus sign (ie, loans)..... And then he sold his houses, stopped his "usual" way of life to which he had spent circa 600 thousand dollars a day, he has sold his aircraft, yachts, the companies .... - And then he stayed in his big mansion with a fleet of cars and thousands of business suits ....
  There are many similar examples in the world. Financial analysis, of course, is designed to answer the main question: "How to earn money for a specific company?". The second major issue on which it is intended to answer - is: "How to save the capital?". In fact, the art of business consists of three pillars, which can be expressed in search of answers to these questions: "How to earn capital?" "How to save capital?" "How to invest capital to extend the life of business?". The same algorithm works for the ruining of the firm. Let's look at the sequence in which the company withdraws from the market: First, the company can"t find the answer to the last question: "How to invest the capital to extend the life of business?" - And it inhibits the investment cycle of the business. After about a year or two, manufactured by company products become more and more obsolete, distribution channels - become more and more weak, there may appear a lot of "legs" at the enterprise, and day after day there are no new investment projects....- That is when the company, due to the presence of the above mentioned algorithm, starts to face with the second question: "How to preserve capital?" - Literally, it can be translated as: "We started having problems with production and with sales!" - And this is a crisis of the so-called operational or operation in the production cycle of a business-system! All this over a period of time results in that inventories" glut grows, not many want to buy production, and the money are needed...and really very much!
  As a result, the company begins to "intercept" the money (here and there - no matter where) to cover the debts arising from temporary.... Here, there is no money to pay salaries - but it is for now, temporarily, in a month we will wriggle out and close the debts, - the companies motivate their behavior. And then the crisis of investment and operating cycles increasingly making its presence felt.... The business affairs of a company go from bad to worse....and the company is beginning to take out loans to cover other, the earlier loans and...a company falls into the bondage of financial leverage in the Russian context .... Then the debt grows, the capabilities fall to cover it - it is the company"s leaving the market that is associated with the crisis of the financial cycle of the company. This is how the most companies become bankrupt in the Russian context! I and you do not consider a fake or deliberate bankruptcy - we consider only "real" bankruptcy associated with this company and its present activities!
  
   Company's functioning scheme [Alexander Shemetev]
   Company's functioning scheme [Alexander Shemetev]
  
  There is the only one way to prevent all this - by carrying out a comprehensive financial analysis and, more importantly, correctly interpreting the results.... You, probably, ask me now: "What kinds of complex financial analysis exist?" - There are two kinds of a comprehensive financial analysis: 1 - These are not complex types (rapid analysis and rating approach) and 2 - truly comprehensive ones: - these are: 1 - comprehensive financial analysis and 2 - anti-crisis financial analysis. Let us consider them in more detail!
  Let's start with the rating approach. Financial analysis - this is quite a complicated thing, - especially when it comes to specific types of companies, such as banks, which are discussed - a bit later. So, suppose you need to conduct a comprehensive financial analysis and, moreover, it is necessary to be carried out all the time. How, then, it should be good to resort by using third-party analysts, who are engaged in it professionally?! In about 10 years ago in Russia it was mostly used only a comprehensive financial analysis and each organization did it within itself, that is, independently from third parties; as well as each organization assessed its competitors. This was justified, because who is thee who can analyze competitive positions and sales in an industry a selected region of presence better than the companies themselves, the companies who work there and who know the major competitors "in face." Today Russia is increasingly resorted by the third-party-financial-analysts-usage, by the analysts who themselves, in most cases, use the rating approach in evaluating companies. The rating approach is especially popular abroad. Rating approach would tend to rank all companies in a seleted industry, or the whole market as a whole by any key figure, or a small group if figures. We consider it fashionable to take such indicators as revenue, operating profit, asset value, net asset value (this is assets minus liabilities). In the west people take these same indicators, plus a couple of fashionable indicators they have, such as number of workers, the payroll, company"s stock price. The rating model has its advantages. It is easy to use, and it allows you to quickly monitor the market, to assess a company as a whole. And, nevertheless, it has some drawbacks. Among these shortcomings can be called too cursory glance at a company and at an industry, the difficulty of forecasting the negative trends for companies, particularly, in the long run, the complexity of the application for the purpose of anti-crisis management, the impossibility of taking into account the discrepancies" facts of official and management reporting in the Russian context, and so on. Thus, the rating approach is appropriate if you want to get a quick overview of some industries and companies that are working there. Apply the rating approach is simple. Ranking methods are of two types: linear and discriminant .
  Linear models of the rating analysis are suggested to do the rating calculation by the only one indicator using, most often, by total assets" sum.
  For more visual perception, let us consider the example of making the rating on the linear model. Let"s have 10 companies taken: # 1, # 2, # 3, # 4, # 5, # 6, # 7, # 8, # 9, # 10, - with total revenues at 61, 56, 48, 41, 32, 28, 22 , 19, 15, 12 million rubles on the profit and loss accounts respectively. It is known that it covers approximately 80% of occupied by the companies market segment in their region. This is the rating (the company number 1 takes place 1, ? 2 - the second place, and so on). That is, to create the rankings, we need to simply rank the amount of indicators for specified companies. Why, then, the model is called linear if involves ranking? The fact that the higher is the volume of a ranked indicator, - in our example, the indicator is revenue, - so therefore the higher is the company's rating compared with the previous ranking position, so, therefore, this implies greater stability of company and the greater business success at the market.
  Discriminant models make the same ranking, and here the ranking rate indicator is derived from real-world performances. The formula for the ranking rate indicator in this model will be next.
  The  formula  for  the  ranking  rate  indicator in this model will be next. [Alexander Shemetev] (0)
  Where: D - resultant discriminant rating index ; A - shows which value is not included in the rating factors, for example, this figure may reflect the market shares of other, unaccounted in making the ranking companies, or it may reflect the current market factors; a, b, c and so on - are the very discriminants, which show us how one selected indicator is more important than another one in the model, and also it demonstrates how well it is more important; x1, x2, x3, ..., Xn - these are financial figures involved in the ranking.
  For more visual perception, let's look at the same example, with some adjustments. Let the importance of revenue in the financial performance of a company is 25%; the importance rate of the amount of equity - 75%; and the significance of net profit - 25%. All data for all companies is performed in the table.
  Table: Summary of companies’ ranking, mln. rub. [Alexander Shemetev]
  
  Let us, for example, calculate the total ranking score for the company number 1 at the market.
  
  Where: 55 - is a conditional indicator, in which will now be ranked all the companies under specified conditions. A = 0, because other conditions for the discriminants are not specified in prior for this ranking. Usually, the sum of the coefficients of discrimination tends to 100% or to 1 in discriminant method of ranking, although it all depends on the specific methods used, and that to which factors the method is attached. Similarly, the data is considered for all the other companies. The calculation results for all companies are listed in the table below.
  
  Table: Ranking of companies ranked by discriminant approach [Alexander Shemetev]
  
  So, it turns out that the company number 5 ranked first in the ranking, ? 3 - is the second and so on.
  That's how the linear and discriminant ratings are to be done for companies in the ranking approach. As it can be seen, the method is quite simple. It can be applied easily to all types of companies, including, without specialists" attraction, and for all the industries. Even people, - who had never seen such a specific type of companies" reporting, like banks" reporting, - should be easy to make their own ratings in all banks of interest on various parameters and decide for themselves - which one is stable, and which one - no.
  However, this approach represents a number of significant disadvantages associated with non-integrated and non-systematic approach to financial analysis. As a consequence, significant "anxiety indicators" of deterioration or improvement in the performance of individual companies can"t be seen. Even in Europe, - where reporting is very transparent, - the application of the rating approach has contributed to the current economic and financial crisis; as this approach was not effectively able to show the actual trends of development of individual business-systems.
  Russia has always had a place to be a difference in managerial and financial accounting, which greatly reduces the effectiveness of the approach based on the rating, applied for the Russian reality.
  Another drawback of the rating approach is that it is fashionable to carry out an assessment from third parties, who are not so obviously interested to find out everything objectively in the internal environment of companies inside a selected industry, as interested in it themselves guide and owners of companies, which are present in a selected market segment.
  Some authors have suggested the construction of scoring and rating systems of the financial analysis of companies, based on the discriminant company size. The concept of discriminant size of a company was introduced to science by Sofia Balkaen (Belgium), being one of the points of her doctoral dissertation defense in 2009 (study 1982 - 2009.). Discriminant company size (DCS) - is the natural logarithm of total assets of a company:
  Discriminant  company  size  (DCS)  –  is  the  natural  logarithm of total assets of a company: [Alexander Shemetev] (0.1)
  Where: ln - is the natural logarithm (logarithm of the "e") of the amount of assets, denominated in comparable monetary value with other companies under comparison. For Russia it is thousands, millions or billion rubles. For comparison with international companies - these are thousands, millions or billions $. All this will have little value if the company compared to the same value, for example, all in rubles.
  Discriminant company size can be calculated from the amount of assets from the proceeds, net assets, equity and so on.
  Now, let's consider the second kind of not a comprehensive financial analysis, a rapid analysis (or express-analysis). Express-analysis - is an analysis of a company, on the one hand - deep, on the other hand, - very fast even with a simple calculator. Sometimes the analyst has no time and resources at hand to conduct a comprehensive analysis of a company, and he or she wants to know what is happening there, inside - really want.... In this case, the express-approach can help you, dear reader, a lot! You can conduct a rapid analysis based on a number of different approaches. Here we consider some approaches, including an approach based upon a model of Dupont, the model we"ll begin consideration of a small part of this chapter devoted to rapid analysis. Then you and I look at some more companys" rapid analysis methods and then proceed to evaluate integrated approaches. So let's start .
  I) Coefficient model of company"s express-diagnostics.
  1) Rapid analysis for firm"s anti-crisis management
  (The method is based on the Dupont model under the supervision of Professor
  A.V. Grebenkin and others)
  So, what documents you and me need at express-analysis of a company based on this model? Well, first of all, we need a balance sheet. Secondly - the profit and loss account. That's enough. Other sources the analysis needs from you are, at least, a pencil, notepad and calculator, you can also have the personal computer in any form.
  After analyzing some company on the basis of this model, you can calculate the feasibility of new venture projects and innovations; you can view what is the impact on the dynamics of return on equity there is in the firm and find out what causes can lead a company to a crisis, to evaluate what to do next to make a business-system little susceptible to a crisis of external and internal environment of an organization.
  Dupont model derived from the very simple formula: return on equity. Let's analyze it:
   Dupont model derived from the very simple formula: return on equity. Let's  analyze it:  [Alexander Shemetev] (1)
  So, 4 coefficients (C) are received in this model (the formulas # 2-5):
  C1 = NP/OC(Eq);
  C2 = NP/Rev;
  C3 = Rev/A;
  C4 = A/OC(Eq)
  If you have difficulties with the identification of these ratios and of the value of the components that income in these ratios, or you would like to strengthen your knowledge about them, please, dear reader, look at the footnotes to these factors at the bottom of the page.
  Note that before you consider the above factors, you would have to calculate another measure: the proportion of accounts receivables in the balance sheet value of the company, which is calculated by the formula (6):
  C5 = AR / A.
  The growth of the negative trend indicator shows the concentration of problems in the financial cycle of operation of a business. It is very likely may indicate problems in the operating and investment cycles of functioning of the company.
  This, as you remember, is an "alarming beacon," which shows that the company may be something quite different from normal. If the value of this coefficient is insignificant - it should not be taken seriously about the above-mentioned crisis probability.
  The real danger begins when the values of this ratio is significant compare to the book value of the company, and when it itself begins to grow rapidly.
  There is the so-called theory of a catastrophic development of all business systems. This concept maintains that a company is doomed to the elimination over time, while the above figure can serve an alarming beacon pointing to the fact that the development of the company is a question of catastrophic model, since this indicator indicates the possibility of significant problems for the company related with liquidity.
  Now let's look at a small outline of what to do when the company"s functioning reveals problems based on our analysis of this model.
  
   Now let's look at a small outline of what to do when the company’s functioning  reveals problems based on our analysis of this model.  [Alexander Shemetev]
  
  Now, for more visual perception of Express-diagnosis model based on the model of Dupont, let us, my dear reader, consider an example.
  Example: Express-diagnostics and the development of anti-crisis strategy of firm based on the model of Dupont
  Let us now consider some important indicators of a conventional company "Nova" at the market, which are presented in the table below:
  
  TABLE: Extract from the balance of
  
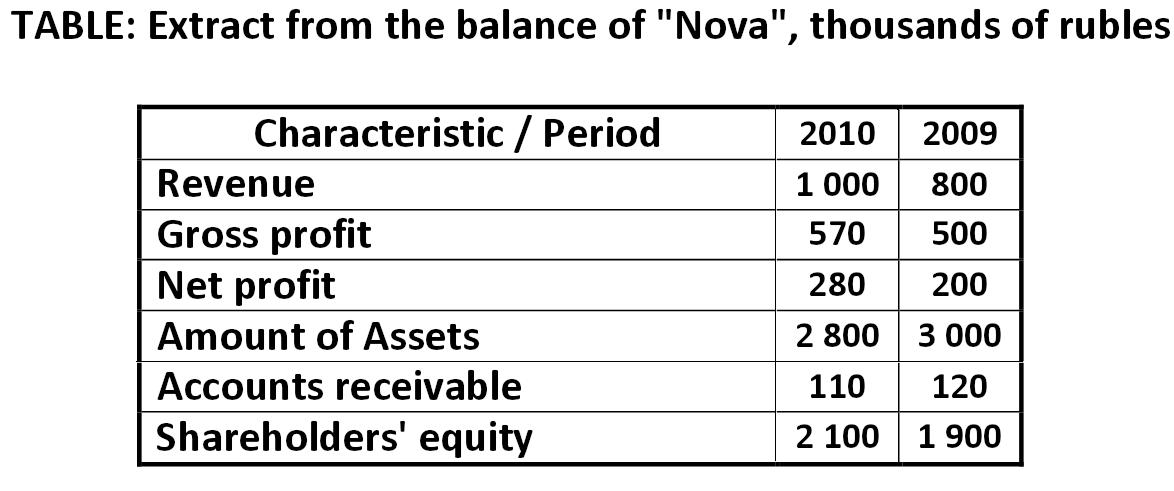
  Data for the calculation of the five ratios and related with them factors is listed in the table below.
  Table: Financial Ratios of
  
  
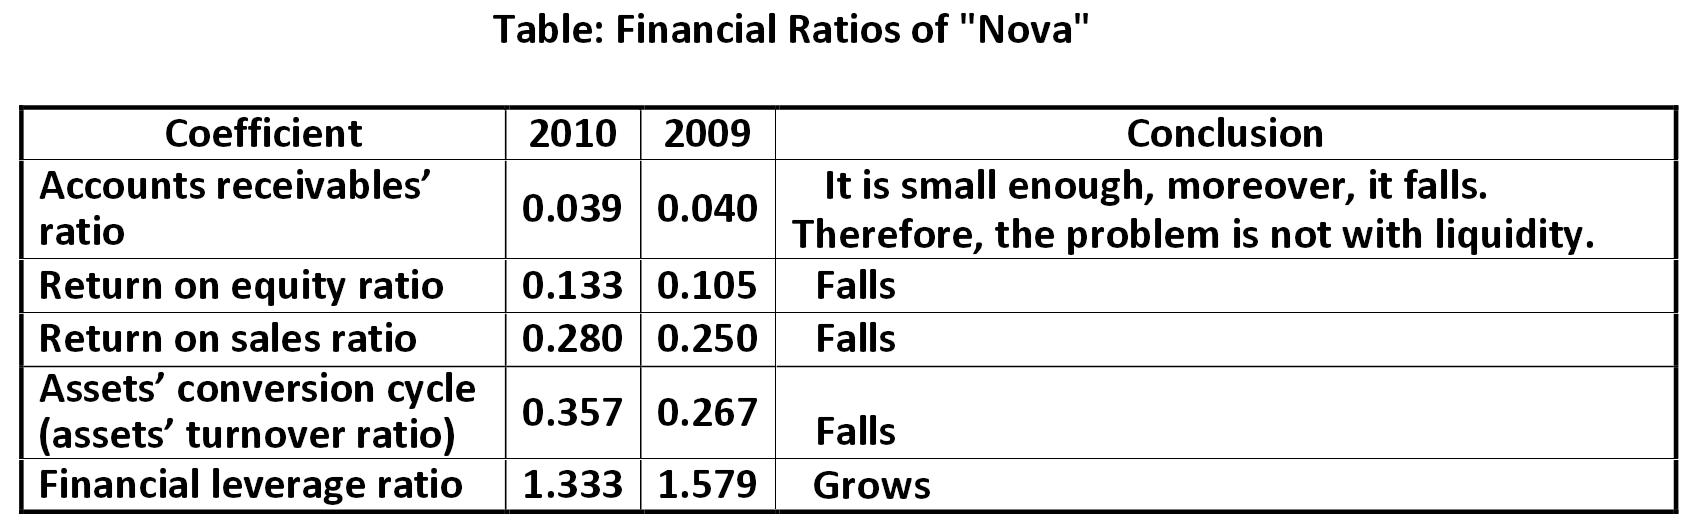
  Thus, we can recommend the following to the "Nova" company, on the basis of express - diagnosis:
  1) Company needs to improve the management of cash flows. This requires a more complex work with debtors and creditors, as well as the following recommendations are necessary;
  2) Company needs for new products and entering new markets;
  3) Company needs for new technologies;
  4) Company needs to improve the quality of management of the organization at the highest level;
  5) It is required a detailed plan for dealing with the crisis of external and internal environment;
  6) Company needs to search for partners and investors, so that in case of crisis to get a subordinated loan from them or to merge with them to avoid the possibility of absorption;
  7) Company needs to search for illiquid assets and to sell them;
  8) It is necessary to reduce costs and expenses;
  9) It is required a shift in marketing.
  
  2) Coefficiental indicators" system for rapid diagnosis of the financial condition of the company both internally and externally on the basis of a systematic approach
  
  I want to offer you another coefficiental model developed by the author. It is to assess the company's financial, operational, marketing and investment cycles. The model allows you to see what to do with company"s management.
  As you may remember, the crisis in the company always starts in the investment cycle, then it moves into the operational (production) and marketing cycle, and, after all, the crisis turns in the financial cycle, when there start the problems with lack of money, liquidity, solvency, which ultimately finishes such company ... and
  if you, my dear reader, is in an urgent need to find out which cycles of a single company have their problems and what are these problems - you can use the model, developed by Alexander Shemetev, to estimate this. Carefully read the following scheme to understand and remember the algorithm better:
  
  
  if you, my dear reader, is in an urgent need to find out which cycles of a single  company have their problems and what are these problems – you can use the  model, developed by Alexander Shemetev, to estimate this. Carefully read the  following scheme to understand and remember the algorithm better:   [Alexander Shemetev]
  
  
  It should immediately be noted that the rate of NP / ((LTL / n)) in long-term priorities of the financial cycle should not be written more than 1.2, even if it is so in fact, for example, 12. This is because the fact the use of short-term loans by a company does not ensure the stability of the financial and other cycles. If the indicator is divided by 0, that is, there is no long-term debt, and then you should just put a 1.2 into this graph.
  In general, this model aims to identify the specific activities of your company. It does not say what is good and what is bad. It does not build some kind of "ideal company" to compare your with it - no. It is simply designed to reveal the specifics of your company and, thus, it seeks to answer the question "What should thou do?", Omitting the scope of all other matters. This is not a model of "Who's to blame?" - it is a model of "What to do?" And "Where to oar in order to bypass the whirlpools?". You know, there is a Japanese proverb: "Never go to sea on a boat without oars." "Oars" - it is a financial analysis: rapid or general. Where to swim - it is you to decide, my dear reader, that is, in this situation you are like a captain or navigator. The author's recommendation is to use the latest navigation systems and maps (of reefs, depths, underwater currents and so on), as well as instructions for the use of modern navigation systems!
  Maybe your company has a critical shortage of liquidity - and it is a key to the success of your business-activities. And this, however, can say that there are urgent problems in the financial cycle of the company, if an indicator does not show the norm and, therefore, you need to make every effort to minimize risk in this cycle, otherwise it can happen the negative outlook of development "by default". By default, if nothing is done - the company's activities are in the framework of crisis, when the coefficients-indicators do not correspond with each other. Then what kind of indicator is not corresponded so, it indicates in which direction to build an anti-crisis strategy. In order to analyze the "weak points" for your company, you can use proposed by the author of this paper matrix. The following footnote symbols are used in the scheme .
  
  Do you want to know what is it in case "by default"? By default, the author proposes a visual model of prediction of risks" concentration in the business-system.
  Now, let's look at the methodology in more detail. Horizontal bars indicate the financial, operational + marketing and investment cycles. The arrows indicate that rates are needed to be looked at the dynamics, at least for a year.
  The general policy recommendations are written in the "Clouds" or each case in the company. Vertical bars indicate priorities: long-term, medium-and short-term.
  Failures in the short-term priority indicators for all three cycles are the most critical, as they are capable to stop the development of this cycle, which can very substantially harm the company. Now, let's consider the critical factors for each cycle in more detail.
   This is a critical factor of the financial cycle [Alexander Shemetev] - This is a critical factor of the financial cycle (7)
  
  In the Russian accounting not all the payments for liabilities can be distributed before the NP forming (this will be discussed later). At the same time, even if it would be so, this indicator would nevertheless reveal the complex risks in the financial cycle and the needs to work with those risks.
  If the net profit for the period is missing (an indicator of less than 1)! - This may mean shortages to cover short-term credit liabilities for this and subsequent periods; it indicates the likely presence of a problem of risk of a catastrophic failure in the functioning of a business-system by causing a lost in the ability of a fully self-finance: temporarily or permanently.
  In this case, companies need to start immediately work with their creditors on possible variations of the payment schemes of debt (even if a company has a presence in the excess funds to cover them). Companies should look for potential and actual possibilities of TL repayment (TL - borrowed funds). Companies need to seek out and sell illiquid assets from turnover. Companies also need to find a subordinated investor or partner, a few more, if necessary, to obtain a subordinated loan (from this name we call such partner), or to merge with it, to avoid absorption or elimination. The company's goal is to find ways to close the debt "holes" in the budget to immediately proceed then to eliminate the problems in operational and marketing cycles.
      – This is a critical indicator of risk concentrations of two cycles [Alexander Shemetev] - This is a critical indicator of risk concentrations of two cycles (8)
  
  These are the operational (production) and the most important for profit generation - marketing.
  If the net profit for the period is missing, and, in contrast to the previous index, - logically (an indicator is less than 1)!, It means that something is wrong with the production and marketing of the company. Either there is the crisis of overstocking, or obsolete technology of production which requires too much storage resources, or the finished product is not particularly taken by customers, or the production process is built irrationally itself, or advertising of the company is limping, .... Or there is something else.
  All of the above can be summarized as follows. In short, this indicator is less than 1 means that the company has serious problems both on the X-Z-axis and on the A-C-axis of production and marketing functions of the curve.
  Next, the author of this paper will consider you the scheme, which shows the structure of company"s goods and commodities on their perception by consumer through the prism of XYZ and ABC analysis.
  
  Scheme: Structure of the goods sold ranged by the class of goods linked with their perception by the consumer
  Scheme: Structure of the goods sold ranged by the class of goods linked with  their perception by the consumer [Alexander Shemetev]
  
  Now, let's discuss this scheme in more detail. It's no secret that the production of the company depends directly on marketing. After all, if you have nothing to sell, then, consequently, there is nothing to produce for a company!
  Marketing, and, consequently, the production cycle crisis is the measure of oversupply, of not the rational organization of the production process. On average, net profit for the period should be able to override the value of inventories and costs. Otherwise it means either that the company has significant problems with overstocking, or that the company wasted cumbersome production process in relation to the organization of marketing.
  Cumbersome manufacturing process must meet an adequate consumption of the product produced by the company. If not, then the value of the net profit is not logically enough to cover the value of inventories and expenses during the same period of time. Therefore, there is an urgent need to change something in the company: reorganize production lines, get rid of items B and C in the range of products and switch the group A.
  The method of statistical analysis of the market should get rid of the errors of calculation, to lead the company from high-risk marketing area or, worse, catastrophic marketing area to the area of an ideal marketing organization, which will be able to provide consumers" loyalty to the company's products, and their loyalty to the company itself, as well as to provide high long-term prospects of the business.
  The third critical factor is a measure of short-term priorities of the investment cycle (8.1).
   This is a critical indicator of the investment cycle [Alexander Shemetev] - This is a critical indicator of the investment cycle.
  
  Scheme: investment cycle: how it transforms company and makes it more prosperous
   Scheme: investment cycle: how it transforms company and makes it more prosperous [Alexander Shemetev]
  
  As it can be seen from the scheme, namely the investment cycle changes the entire direction of the company"s development. This cycle is as if the company is re-created anew from time to time to become more technologically advanced, more competitive. And also that company would be able to carry a unique selling proposition to its customers, practically unique to the competition, a unique in satisfying customers' needs much more efficiently than the competitors" ways, so unique that it carries a more powerful information PR-shell, which creates a demand in society for goods of a company.
  PPE (property, plant and equipment) acquisition should be significantly greater than PPE outflow, indicating that the modernization of the production process persists in the company. There is the problem within the domestic firms of PPE obsolescence, without mentioning the external, physical and other kinds of wear.
  As a consequence, the production base of a company must continually develop to meet both modern Russian state of technology in an industry, and foreign experience, since it is no secret that the more and more new waves of more successful in financing activities global foreign and multinational companies come to Russian domestic market.
  In addition, the forecast of what there is to be in the next 10 years or more - it is almost unreal. That is why the present dictates the need to continually update the material and manufacturing base for the Russian companies.
  If a company does not follow this algorithm, the present is so, that even if it is successful, even when receiving profits (and this is one of the best variants for development of the situation); - this is due to the onset of the aristocratization stage from the theory of catastrophism. This stage involves a conservative financial strategy and the lack of large investments in permanent "rebirth" to the new technological and moral level (of the fashion, style, modernity, .....).
  If there are no large investments - there are no big spending .... Hence, it is a hidden stage of the internal crisis in the company, since the development is not happening. However, in compensation, such company receives a windfall.
  During this time the competition is improving and the company is rapidly being "left out" of development. Usually this means a gradual decline in sales, therefore, problems with production, overstocking, and then with Cash ... ..
  Well, what is next - I think that you know it by yourself! It is this state of "temporary idyll", named Aristocratization by Adizes (Adizes, 1989, 1998), the state which ruined at the time, and promptly ruined, Mr. Adnan Khashoggi who was a multimillionaire, and who in less than 10 years lost, perhaps, more than $ 70 billion due to the fact that he missed this point....
  You, dear reader, probably, now ask me, what is the hierarchy of all these cycles? The hierarchy is as follows. The most pressing problems for the company are prepared by this financial cycle as it rotates financial resources, and this is where the problem starts with the solvency of the business.
  Second in the hierarchy is the marketing and the associated operational (production) cycle. This cycle - is a basis of generating cash income for the company.
  And the third most important is the investment cycle, which should provide the company's prosperity in the long run.
  The following factors are no longer critical, and they show the urgent problems of the company in all three cycles. We begin with the most critical cycle, financial. There raises the following figure (9):
   An indicator of the urgent problems in the financial cycle  [Alexander Shemetev] - An indicator of the urgent problems in the financial cycle
  Ideally, a company must have enough net income to cover all emerging payments on debt, both short-and long-term for payments averaged appearing in a certain year. That is why the denominator of this formula is the sum of short-term loans plus averaged index of imputed payments on long-term debt.
  If the value of (9) is less than 1, it indicates a high probability of the presence of urgent problems in the financial cycle. This means that a company needs to work through risk management strategies in the management aspect of financial flows in case of abrupt changes of the bifurcation shifts in the financial environment.
  The rate of company"s business activity should be analyzed to understand what is happening.
  If business activity is high, then it may indicate high-risk activities of the company, which imposes itself on the need for risk management strategies, for example - the creation of reserves.
  In any case, such companies are likely not to innovations. Such a company should identify high-risk illiquid assets and sell it from turnover to extinguish the debt, such companies need to build up reserves, to seek subordinated partners for the future, to conduct stress tests and so on.
  The recipe here is one: to segment all the activities of the company for cash flow and to manage them!
  To ensure that you could easily segment the company's activities for cash flows, the author of this paper will offer you, my dear reader, the following scheme.
  
  To ensure that you could easily segment the company's activities for cash flows,  the author of this paper will offer you, my dear reader, the following scheme. [Alexander Shemetev]
  
  Denotations in the scheme are as follows .
  This matrix will let to analyze the performance of both Russian and foreign companies, dividing their business activity on the set of cash flows. Black markers in the scheme indicate paired indicators of cash flows.
  In case of problems in this cycle, it is necessary to segment your company's activities for such cash flows and to analyze it. Now, let's figure of urgent problems in the operational and marketing cycle of the company (10):
   An  indicator  of  the  urgent  problems  in  the  operational  and  marketing cycles [Alexander Shemetev] - An indicator of the urgent problems in the operational and marketing cycles
  Ideally, production and sales must be placed in the company so that the amount of revenue could cover the amount of current assets, that is, that figure (10) would be greater than or equal to 1. This suggests that the production is well-functioning, and the marketing is well-organized.
  If it is not so, then there are some pressing problems in the cycle associated with a slowing of business turnover.
  If the specified delay occurs, the company, if it is connected with the normal functioning, is necessary to create, possibly, non-core subsidiary company in industries and sectors that are able to provide constant revenue. That is, companies need to consider the feasibility of introducing new products, they need to find new markets and customers. Also they need to control production in order to minimize the amount of current assets, primarily receivables and inventories, including the amount of finished products.
  All this can be done only through a successful marketing organization.
  Therefore, please see the section of the financial analysis of the marketing plan in the other publications of the author. We now consider the following measure of the current problems in the investment cycle (11):
   An indicator of the urgent problems in the investment  cycle [Alexander Shemetev] - An indicator of the urgent problems in the investment cycle
  It so worldwide - a staff is considered as the foundation of any company ...
  The following argument served as Pretext. It concerned the fact that there are industrial super-companies that are ready to get out of their skin by means of aggressive marketing to increase their sales, hence, production.
  These wisent-bisons of business, having a super financial power, super volumes of current and non-current assets - they are often not able to provide high margins above 8% per year, recalculated to IFRS standards! That's it!
  And there are some companies who have to balance only a building, a handful of computers, and they were able, just for a few decades, to grow to super-corporations like Microsoft, Apple, Google, Yahoo, Facebook, ... .. They usually don"t have so many recourses on balance as those wisent-bisons of business. And their profits ... .. are phenomenal!
  Is it a just people who are able to make out of ordinary houses and their own knowledge and skills, something considerably more than even the largest classic wisent-bisons of business among manufacturing companies.
  People began to wonder how this should be considered - a positive effect on staff in the balance. It is still a hard question for a science today - how to estimate the HR?!
  There is a point of view to consider HR as a part of company"s overall goodwill. Today it is widely considered to reflect goodwill on balance of those operations that come from business-combinatorics (for example, acquisitions).
  Goodwill - is an intangible asset, the difference between the actual market value of the company and how much it costs on the balance sheet. Some companies try to estimate the full value of goodwill in their internal financial analysis.
  The companies that rely on the knowledge and skills of staff possess the largest financial goodwill, ie, companies of services (creating the software, support information flow, educational institutions, private upscale clinic (people travel to the U.S. clinics from the around the world on a very much fee basis), financial consulting, legal consulting, including major notary network, and so on).
  In fact, these companies are selling ... the knowledge and skills of their employees, their interest in working for this company, that is, knowledge and skills of staff in conjunction with the corporate culture.
  In fact, such companies very rarely do the material production, and they are able to give odds to industrial wisent-bisons of business!
  Currently, conventionally, all companies are generally classified as mechanistic or organic, depending on how wide the intellectual potential of the staff is used. To learn the difference between a mechanistic organization from an organic one - you can learn it from the literature on corporate culture.
  In short, the mechanistic culture - is a classic bureaucratic structure with a horizontal system of command and execution of orders, and sometimes it holds the departments of coordination and strategic business units, that operate relatively independently of the structure as a whole, and are subjects only to the top of the power of this type.
  Personality in this structure is respected, at the same time, the organizational culture is not particularly stimulating creativity and ingenuity of workers. Where it is necessary, the mechanistic type of culture may be optimal. At the same time, it is not fair for the post-industrial companies.
  Organic culture is characterized by companies with a corporate culture in the best traditions of models of Peters-Waterman and Sashe. That is, decisions are made jointly with the employees, there is a promotion of openness/closeness of communications, the principle of collective perception of a positive organizational environment, it encourages risky actions of employees within their competence and knowledge, and so on. All this must be based on faith inside the company and the activities of its employees.
  The world today has about 78% of large companies that have a mechanistic type and 22% - organic.
  There are some other non-Maneggiare approaches (from the old. Italian. Maneggiare-"Get in the hand (tool)" and the old. Lat. Manus - "The Hand"), that are not related to marketing and management; these are the approaches that try to make an interpretation of the success of postmodern companies in comparison with classical multinational and global corporations.
  And now, let"s go back to our consideration of the indicator.
  Staff - is a long-term key to success for any company. Nothing hurts the company as much as the retirement of staff. Staff is one of the most important guarantees of prosperity of any company. Because of this fact, the number of employees must not decrease itself, otherwise, it should be mentioned, it testifies about the possibility of internal crisis inside the company - it testifies about that fact that company can"t attract and retain the employees by its corporate culture, and so they may go to a competitor of such company, or, at best, to other sectors (that may also indirectly hurt the company).
  In the case of staff decreasing as a result of lack of competence - it is better to replace it with a more suitable personnel because it determines the success of the company and its revenues in the long term, as well as an investment perspective. Investments in personnel - this is usually a long-lasting investment.
  Now, let's look at all three cycles: the operational and marketing, investment and financial - let's look at all three cycles from the standpoint of long-term strategic prospects of the business-systems (12):
   An indicator of long-term risks in the financial cycle of the firm [Alexander Shemetev] - An indicator of long-term risks in the financial cycle of the firm
  If net income is not enough to cover the average arithmetically weighted amount of borrowed funds, then this indicates the presence of risk problems in the financial cycle. These problems should be resolved if time is on their resolution....
  In this case, you should use the precious time to increase sales, perhaps, in new markets. You should also seek out and sell illiquid assets, reduce production costs by its components, to seek subordinated partners and so on.
  Everything should be directed to the alignment of the company's market in the future, or to prepare the company to bankruptcy with minimal losses in the future. As well as in the previous case, we should pay attention to the partitioning of the company"s activity to cash flows for company"s best advantage, as it is shown in the scheme, which I have already given.
  In this case, you must decide whether to continue funding the company will likely lead to the modernization of production and bring the company to a new production level. Or it will likely lead to even more compelled taking of additional loans to fill the financial gaps. Consequently, then over and over again, once more, again and again - and as long - until you do not stop or turn into a "minus millionaire" (a person with the amount in his or her accounts of 1 million or more, with a minus sign and actual numeral value). In general, this is the way which all the bankrupt-companies follow until their stop - so, it is important to answer this question fair.
  If there is a sense of something better - you should do it quickly.
  Otherwise - you need to minimize losses and to maximize the output to prepare the company for leaving the market in the future in the most secure way possible.
  In principle, the critical indicators that show whether your company is able to cover its debts are the following:
   In principle, the critical indicators that show whether your company is able to  cover its debts are the following:  [Alexander Shemetev]
  If these values are more than 1 - this is normal. If are not more than 1 - this is not normal! The coefficients show whether the cash from the sale of your goods is enough to pay debts, or the company will have to use non-continuous operations and/or have to take more loans .... then more ... more ... and more again....
  Of course, such figures may be caused by the temporary crisis changes in the environment. Even in this case, it shows that your company is exposed to them. The work with these risks should be a priority.
  However, we do not take the revenue - we take profit as an indicator that something should be done. It shows the direction in which a firm should dig in the future to avoid problems and to maximize its effectiveness ....
  Now, let's look at the problems associated with operating and marketing cycles over the long term (16):
   This is a measure of the normal state of operational and  marketing cycles in the long run [Alexander Shemetev] - This is a measure of the normal state of operational and marketing cycles in the long run.
  It shows that companies have enough revenue from main activities enough to cover the current assets and there is a reserve equal to the total value of stock material for the production and sales, which are calculated like one more time, like covering the reserve.
  If the ratio is less than 1, it is necessary to improve production technology and production lines on which there is still enough time.
  Indicator of long-term investment cycle in the normal state is as follows (17):
   An indicator of the normal state of the investment  cycle [Alexander Shemetev] - An indicator of the normal state of the investment cycle
  Remember, dear reader, we spoke with you about the importance of human resources? So, it is necessary that the staff turnover was minimal for to ensure long-term prosperity of the company and the normalization of the investment cycle. It should be so even with influx of workforce. That is why a personnel should be selected especially carefully.
  This does not mean that you can"t dismiss - not at all! If you had many to dismiss, therefore, the personnel policy of the company is poor and needs to be more effective, because originally it was necessary to select the workforce corresponding to a specific of a company.
  Also note that one should take the time to calculate the determinant of the resulting matrix (table) of Rapid analysis of the company. Determinant - is a mathematical component, geometric and graphical meaning of which is the volume of a polygon described by the matrix. So, the determinant of this matrix, it is desirable, should not be greater than 0 with five characters after the comma, that is, the graphic standard deviation of the risk should not be folded. The determinant of this matrix system is considered to be in accordance with the following scheme :
  
  Scheme: Calculation of the determinant of the matrix system of indicators" rapid analysis
   Scheme: Calculation of the determinant of the matrix system of indicators’ rapid  analysis [Alexander Shemetev]
  
  To learn how to quickly calculate this matrix without any formulas - see the note .
  I think many of you are familiar with Sudoku, the Japanese crossword puzzles. So, the matrix - this is a very similar thing! In general, we will return to the matrices, when it comes to financial analysis of portfolio of securities. There's matrix analysis to evaluate the optimal portfolio. Also, you and I will build an optimization model of the firm, based on matrix analysis, developed by the author of this paper. And there are much more complex matrixes to be calculated, that is why we shall not spend time for their calculation - we will use software means. I think, all of you have an Excel?! If not, then you can do it later on the computer when you will have such an opportunity. In the meantime, take, at least, a pencil, notepad and calculator - this is for now enough, so you can learn all the financial analysis in a very good volume.
  Determinant of the matrix in this express-analysis model should be obtained and comply with five zeros (+ / - 0.00000).
  Also, this model allows us to predict what will happen to your company, if nothing would be taken, within how many years it will most likely come from the market. This matrix and this model were developed by Alexander Shemetev, who is the author of this paper. The model of this calculation is shown at the diagram below :
  
   The model of this calculation is shown at the diagram  below [Alexander Shemetev]
  
  Thus, the formula for calculating the company"s risk reserve is the following:
   Thus, the formula for calculating the company’s risk reserve is the following: [Alexander Shemetev] (18)
  The end result, resulting in this formula, will show you what risky reserve your firm actually has. Reserve appears only when the value of the formula is above 1. This formula allows us to calculate the reserve of resources" availability to raise the capacity of the investment cycle.
  If the ratio is obtained by less than 1, then the inclusion of company resources in the investment cycle can be irrational.
  The calculation of the actual reserve should be made by the following formula:
   The calculation of the actual reserve should be made by the following formula: [Alexander Shemetev] (19)
  Deficit shows how much money the company would be forced to cover the expense of third-party financing sources in a normalized manner. The deficit in more detail I together with you will look a bit later.
  This model also allows to calculate the period of risks" focus, which can in the shortest possible time to take the company off the market. This risks" focus is the financial cycle functioning abruption risks" concentration for company, therefore, it is also connected with the investment and operational cycles.
  The advent of risk can be considered through the focus of two formulas: the total life cycle of the company and methodology for calculating the critical point of termination of cash flows. This concentration of risks comes in, if not to prompt the up-to-time anti-crisis policy of the company's financial, operational, marketing or investment cycle.
  Calculation of the onset of the maximum concentration of risks in the method of determining the risks" concentration point of the life cycle termination will be calculated in accordance with the following matrix, developed by the author of this paper:
  Risky streams cycles" and risk components" rates decomposition matrix
  
  Risky streams cycles’ and risk components’ rates decomposition matrix [Alexander Shemetev]
  
  The formula to calculate the total concentration of risks, which will show how much the company will have time in the event of a crisis dynamic of external environment is presented below:
   <img src=f20.jpg> [Alexander Shemetev] ** (20)
  This formula will allow you, my dear reader, to analyze any company from the inside and find out how much there will be time in the event of continuation of crisis trend dynamics in the external environment, that is, if the market and the economy situation do not change in favor of the analyzed companies.
  For example, if the coefficient A has turned 0.6, the coefficient B - 0.4; C - 0,5; D - 0,7; E - 1,2; F - 0,9 for a company, if the external environment crisis development trends will be dominated at the market, it will have only 1.55 years for the implementation of anti-crisis policy.
  However, in Russian conditions, you should always bear in mind exactly who is an observer of risk trends. This technique is designed to analyze the company from the inside. In Russia, one should take into account the fact that the accounting and financial-accounting may differ, including, for purposes of tax optimization. Therefore, to calculate the third-party organization one should use a different model, which we with you, dear reader, will look on.
  
  Methods of calculating the critical point of termination of cash flows
  
  This technique also developed by the author of this paper, Alexander Shemetev. It assumes that the actual concentration of risks, that are sufficient for termination of the company, comes not so much by the loss of the possibility of self-sustaining itself at the expense of normal activity in the market that was calculated by earlier methods; the next situation is taken into account: that later, a company would likely attract a critical mass of borrowed resources due to its lack of effectiveness, which could serve as a strong impetus to the bankruptcy of a business-system. This technique will allow you, my dear reader, to know when that moment happens for a specific company.
  Now, let's talk about such phenomenon, as the assessment of some of the company and its cash flow limit. Third-party companies, like you, my Dear Reader, remember, they can use and can very much apply as well as they can not to apply the different optimization transformations of financial reporting, for example, to optimize taxation.
  Perhaps you, my dear reader, have a composed question: whether it is possible to know whether the third-party firm applies and to what extent the optimization transformations of reporting by means of rapid analysis method?
  And, probably, the second question you probably have in your head is how to check if everything is normal with the third-party organization by analysis through the prism of optimization transformations?
  I am very pleased that you have in mind such questions - it says that you carefully read my book! I am very pleased to this fact! Thank you for it! Now, let's get down to business and begin to lift the veil away from the optimization transformations of all sorts and very fast by means of rapid analysis methods.
  What data do you need to conduct a rapid analysis of any company through the prism of the probable optimization transformations of domestic accounting reports?
  You, my dear reader, will need the following information about the firm : TL, OC(Eq), NP, Rev, STL, LTL, Inv, MobA. The footnote at the bottom again says the meaning of each record.
  It is not necessary to take these figures from a third party secretly, with insiders . For you it will be enough to have the simple data of the official reports of companies - it is not necessary to obtain more data.
  So, suppose you got the data (Goskomstat, tax, friends, ....). Now, let's analyze it.
  
  First, we analyze for the presence of accounting optimization transformations by the method of matrix analysis of the normalized distribution of risk.
  
  If the probability of optimization transformations or their volume is negligible or small, or the company's activities are not linked at all with some specific way to meet customer needs in a given market segment, the matrix analysis shows no abnormal distribution of risk: graphically the risk polygon does not arise in the space.
  In this case, since data on the investment cycle may not be known, we will construct a normalized matrix system of optimization distribution of risks. In this case, please do not forget the factor C, which in the case of a low share or a lack of long-term debt - it can never be larger than 1.2. Why it is so - it was explained at the beginning of the description of this technique.
  So, we have calculated the coefficients A, B, C, D, E, F - the rest, the coefficients of the investment cycle, are not to be calculated by you, my dear reader. We should take them normalized: X = 0.2; Y = 0; Z = 0.05.
  Let's examine an example of rapid method of financial analysis of company. Let for some company the coefficients are equal: А=0.1275; B=0.1253; C=1.2; D=0.1543; E=2.9474; F=1.6610. The author of this paper will not get the baseline data, realizing that it already is included in the calculation. Also, knowing it by default, they can be estimated from the data of the coefficients, if known, for example, that the amount of revenue is equal to 400 000 thousands of rubles, the amount equal to the STL is equal to 120 000 thousands of rubles.
  For practice you, my dear reader, you can practice to solve such like financial problems - to analyze the statements by several known data! So, we form the matrix system and calculate the determinant .
  
  Optimization risks' allocation normalized matrix system's calculation example
  Optimization risks' allocation normalized matrix system's calculation example [Alexander Shemetev]
  
  In our example, the determinant has turned out significantly different from 0. It says something about a specific abnormal riskiness industry (which can be determined by comparing the determinants of the matrices of various companies in the industry), or whether there are grounds for suspicion of deviation from these official statements.
  Companies are required to keep the revenue in banks and more or less reflect the short and long term borrowings of the company. If something goes wrong, for example, the company has a keen insufficiency of net income to cover debts arising (abnormal underestimation of the coefficients A and B).
  At the same time, the company doesn"t use long-term loans to cover the difference in the limit of coverage and lack of funds (the coefficient C is equal to a maximum of 1.2).
  In addition, the amount of company"s revenue is super-big (indicator E "off-scaling"), and even so great that the company has a reserve of at least 66% (high value of the index F).
  Thus, something shifts the determinant and the matrix system begins to emerge graphically the regular polygon of the anomalous distribution of risks (the value of the determinant (a measure of the volume of the graphic shapes) is more than + / - 0.00000).
  Or it can be normal for the industry that can be set by analyzing the activities of companies in this market segment, or an abnormal distribution of riskiness is caused by something else.
  Also note that if you do not know what is the average maturity of long-term debt in the company, for the purposes of analysis it is possible to use a normalized period: 2.5 years or an average for the industry - most importantly is to determine the methodology of this indicator so it not to be changed for a number of similar companies during this analysis.
  You, dear reader, probably, ask now: "How to analyze the specific companies with an abnormal distribution of risk?". If you are an internal observer, you can use the above method. If you analyze a third-party company, you can try to calculate the index of normalized net profit (NNP). NNP is calculated from industry-averages profitability rates, industry average net margin, industry average return on equity or either taken from the proceeds.
  Thus, if the industry average return on sales (net income to the revenue) is 12%, you may take the revenue multiplied by 12% for third-party companies. This will show a standardized pattern in a particular industry.
  Now let's analyze what some anomalies in the determinant mean for the company. The following diagram is intended to illustrate the answer.
  Especially it is necessary to comment the situation where NP is positive and the determinant of the matrix is less than 0.00000 in the analysis of domestic companies. In the scheme before I gave that a strongly negative value of the determinant may be indicative for the specific business risks associated with abnormal risks (in this case, you must carefully manage the finance in the first place, and marketing in the second), or it may be associated with the use of optimization transformations of reporting so that there is an anomalous figure of graphical distribution of risk equal in volume to the determinant of the matrix /negative volume - consider it as the same positive amount, and the figure graphically located on different axes with positive/, or it can be a left or an abandoned business, or a company goes bust with enormous financial difficulties, or simply the company clinched a super-profitable windfall at the moment ...
  It is possible to learn more particularly the state of affairs within the company, as mentioned earlier; it is possible by comparing the selected company with the actual expected industry average profitability of the revenue or of the value of assets. This return is a rate of return on investment of sufficient volume of investors so they preferred to invest temporarily free funds into this market segment.
  It is better to calculate the expected profitability of the industry average with not much relying at the reported data of the industry-average-return in an industry. It is especially fair in case of suspicion of the practice of optimization transformations usage. It can be better to rely on your own analysis of cost-effectiveness of derived by you data on companies in which you can evaluate the actual average cost-effectiveness of these indicators. Then you may compare these indicators with their average values. If the return is higher than the industry average, it probably makes sense to use these data.
  
  Then you may compare these indicators with their average values. If the return is higher than the industry average, it probably makes sense to use these data. [Alexander Shemetev]
  
  In any case, the application of this matrix model is designed for the maximum possible consideration of optimization transformations and errors of reporting. That is why you can just use matrix analysis based on available evidences, while comparing the results with similar companies in the segment, in which the true state of affairs is more or less known. Thus, you can compare your company with other business-systems for your market segment and find out the status of the company.
  Let"s now look in more details next: the risks focus point"s calculation and the period it occurs in case of crisis trends. That is, this period - is a kind of pathological scenario of "disease" development of the particular company, which was identified by means of express-analysis.
  The point of concentration of risk will relate to the abovementioned risks, depending on the determinant of the matrix system (please, see the classification of the determinants of the matrix system, which can be seen in the diagram above).
  Now, let's calculate the value of the critical point of termination of cash flows. This figure can be considered just without any normalization of the net profit for third-party companies - an opportunity for optimization transformations is already incorporated in the calculation of this technique. So let's start.
  The method assumes that about one fifth of company"s cash flows" circulation depends on the amount of borrowed funds, due to the often negative effect of the mechanism of financial leverage in modern Russian conditions (it is discussed later). Ultimately, if the borrowed funds in the company are too much, the cash-flows will go out such companies directly to the hands of creditors.
  And 4 / 5 of company"s cash flows" circulation depends on the financial, operational, marketing and investment cycles. So, let's consider two risky components separately.
  
  1) The company"s cash flows" circulation component depending on the amount of borrowed funds
  
  So, let's define the boundary of the capital which can border the moment when the cash flow amounts start to flow out from companies to the creditors. The author of this paper argues that this occurs when the amount of equity capital is less than 11% of the borrowed funds.
  The same limit set, in particular, by the Cook coefficient for the companies that get all their additional income from lending and investment activities - for banks. Thus, the first component of the remaining time term on the anti-crisis strategies" use for companies is:
   Thus, the first component of the remaining time term on the anti-crisis strategies’  use for companies is:  [Alexander Shemetev] (21)
  2) The company"s cash flows" circulation component depending on financial, operational cycles" functioning
  
  
  The success of a company depends neither so much nor only from the use of credit resources. It depends on the normal circulation of cash flows. Ultimately, if the production of a company nobody buys, then it may soon leave the market.
  The main collateral for long-term prosperity and success of a company is behind the prism of financial, operational, marketing cycles. Even if a company's debt amounts are significant, and the revenue will be enough to cover them, such company can be sustained.
  I must enter the number of components to calculate the time that a company has for the anti-crisis-strategies" realization. So, I think, you"ve got an acquaintance with the deficit. Let"s see it another one time, and this time relative to the time that a company has for the anti-crisis-strategies" implementation can be calculated by the formula developed by the author of this paper:
   So, I think, you’ve got an acquaintance  with the deficit. Let’s see it another one time, and this time relative to the time  that a company has for the anti-crisis-strategies’ implementation can be calculated  by the formula developed by the author of this paper:   [Alexander Shemetev] (22)
  This deficit indicates the share of funds one will have to look on the side to cover the shortfall in the financial, operational and marketing cycles. Now, let's define the amount of funds that fall into deficit. As you may remember, financial, operational and marketing cycles are added for 4 / 6 of the net profit and a 2 / 6 of sales" revenue. Then the deficit base will be determined by the formula developed by the author of this paper:
    Then the deficit base will be determined by the formula developed  by the author of this paper:  [Alexander Shemetev] (23)
  The remaining time on anti-crisis measures in the functioning of the company's financial, operational and marketing cycles can be determined by the formula developed by the author of this paper(24):
   The remaining time on anti-crisis measures in the functioning of the company's  financial, operational and marketing cycles can be determined by the formula  developed by the author of this paper(24):   [Alexander Shemetev]
  
  This period expresses the remainder of the term for anti-crisis strategies before the focus the risks associated with the fact that cash flows can be almost entirely the interests of third parties, if nothing changes from now. Too long term value of this indicator testifies the minimum scarcity of funds to cover the needs of financial, operational and marketing cycle, and the company makes sense to work specifically on the investment cycle.
  In this case, the graph of this function behaves as follows. After approaching an infinitely large number - it abruptly becomes negative, without going to small values (1,2,3,4,5,6, ....) due to deficit component. The negative value of the index testifies the lack of pronounced deficit to cover the needs of these cycles.
  The low values of the indicator can also be caused by low values of revenue and profit in a particular company. In this case, it is likely for the company owners to focus on the investment cycle in terms of finding a new market segment or the possible closure of the company, which could give higher returns, unless, of course, lower revenues and profits are not caused by short-term crisis trends.
   The cumulative time of risks" concentration is calculated as follows:
   The cumulative time of risks’ concentration is calculated as follows:  [Alexander Shemetev] (25)
  Let us now consider what is most likely to do for companies whose risks concentration term is extremely low.
  The value of the specified term of less than 1 is, most likely, due to a strong failure in the financial cycle. This company is likely not for innovations and improving its product lines - it should be dealt with plans to repay borrowed funds. There may require an agreement on debt restructuring projects, the identification of illiquid assets and selling them, work with debtors and buyers, search for potential subordinated partners, obtain of a subordinated loan or merge with subordinated partners to avoid absorption.
  Or sometimes it is necessary to prepare the company to bankruptcy in order to avoid unnecessary credits to cover the shortfall in liquidity. Such-like provisional means are of no actual use for operational and marketing cycles - is just moves aside the financial day of reckoning the debt.
  The value of the specified term from 1 to 2 and slightly more than 2 means that company has integrated problems. On the one hand, these are credit problems, at the same time, the mobility and high business turnover of the company is likely to provide sufficiently long period to be able to solve them.
  On the other hand, this is the problem of a narrow attachment of the marketing cycle to individual buyers. Most probably, such company uses a contractual strategy or similar development strategy, at the same time, there is no great demand for the production of a company.
  Under given conditions it is necessary to look for opportunities to expand low-cost opportunities to increase the range of products and finding new customers and markets, and, probably, inexpensive means to advertise products.
  Value of the index significantly above 2.5 (not more than 8) means that problems in the company are caused not so much by financial cycle - the problems are mostly caused by operational and marketing cycles. Perhaps, the demand for the company's products began to fall. In this case it is the demand you need to pay the most attention in the anti-crisis strategy realization. Also, the company should probably improve the manufacturing process and make both the process and its products more adequate to modern market requirements.
  Value of the index of more than 8, most likely, means that the problems of the investment cycle begin to move into the production and marketing cycle. Probably, the competition becomes tougher and much production has gradually been becoming obsolete and leaves the market, it can not to be yet very noticeable. Such companies need to establish, first of all, the investment cycle.
  A negative index value is dictated by, most likely, the lack of deficit to meet the requirements or abnormal ultra-low rates of revenue and net income for an individual company, that alone takes decisions into the sphere of the investment cycle: improving performance of the company for long-term prosperity, or search for a new market segment for more High income in the future.
  In any case, positive and negative (it is, as you will recall, takes the solution of problems into the company's investment cycle) values will allow you, dear reader, to know the potentials for anti-crisis strategies in time and in quality (due to application of the above matrix system). You may calculate it for you and for your competitors, which makes navigation in the business more transparent and, thus, the analysis does not take much time and resources.
  It should also be noted that this model is intended for use not only for domestic companies, and also for foreign companies, if they use one of two methods of accounting: IFRS (IFRS) or GAAP (GAAP).
  II) Using a model of an ideal company for rapid analysis
  Model of an ideal company is an idealistic approach to the rapid analysis of the company. In principle, along with the rating approach, it is the most common approach both to company"s express-diagnostics and also to complex financial analysis of business-systems in general.
  Banks are now trying to apply these two approaches: an approach of rating analysis for "gold customers" (by rating customers of different banks on their credit histories) and an idealistic approach, which applies in all other cases, although sometimes it is used together with the rating approach as an adjustment method.
  Idealistic approach assumes that there is some ideal company for each industry, which both is perfect in the industry it operates and has the perfect ability to pay, creditability, financially unsinkable, sufficient business activity, profitability, development dynamics and management. Sometimes some more ideal indicators are to be applied for the analysis, such as distribution geography of company"s branches.
  Accordingly, the vast majority of the remaining firms differ themselves from the ideal. The more they differ from it - the worse it is .... How much worse - it is usually set up by an analysis, which is often conducted using a scoring system for evaluating a company. In such scoring systems some certain score or point is to be subtracted for each percentage of divergence from the ideal.
  Thus, the company distances it from the ideal business system and, consequently, the more points there will be deducted from it, the less stable it will be. The more score-points a company picks up - the more stable it is, and vice versa.
  Dear reader, please note that the modern market economy has virtually no regulations, which may correspond to a successful company. Thus, many Western companies have profit margin less than 1.9% per year, while the volume of their loans may exceed the volume of equity capital, for example, in 5 times! On most domestic scoring systems, such a company will automatically receive the label "not an ideal - almost a bankrupt!". Financial sustainability will be minimal, the probability of preservation of solvency - too! And just by looking at the name of a company like "Metro Group" an analyst who applies the scoring method may doubt that it showed all the right ....
  After all, everyone knows that this company can surely be attributed to a very successful, and almost every bank will be happy to have it as bank"s client. Incidentally, the vaunted scoring approach will hardly count a high score for companies such as Auchan, Toyota and some other companies .... After all, return on sales is less than 1.7%, borrowed capital and almost all of it - is both a short-term and overtops equity taken together with profit in several times .... However, these companies are more or less successful.
  Once again I"d like to repeat, that not many norms and "Perfect companies" are left in the modern economy. Idealistic approach would be an ideal approach for a stable and static (unchangeable) planned economy, for example, such as it was in the USSR. The modern world has virtually no static economies, and, because of this fact, the actual relevance of the scoring approach has steadily been declining with the rising-in-inverse-proportion popularity of its use ... .. This does not mean that the scoring approach is "bad" - no! If you want to learn a lot about the company and quickly - it is better to use the coefficiental models, which, unfortunately, are very few developed yet....
  Nevertheless, the book about the complex financial analysis can"t ignore the most classical approach to it - the idealistic one. Because of this fact, let's get together to analyze the available techniques in the concept.
  1) The model of an ideal ratio of assets and liabilities
  We consider one such model as an example. This model is of a general theory of an ideal ratio of assets and liabilities for industrial and commercial companies. So, let's look at the figures, which are needed for the analysis of the company, once again - they are in a footnote . For rapid analysis of the company, we need to get acquainted with the notion of perfect balance, a simplified scheme for which for the industrial and commercial firms is set out below:
  Scheme: rapid analysis following the model of ideal ratio of assets and liabilities
   Scheme: rapid analysis following the model of ideal ratio of assets and liabilities [Alexander Shemetev]
  
  It is clear from the scheme that an ideal company has a restricted structure of assets and liabilities, at the same time, the owned funds sufficiency (which shows the availability of internal funds) and liquidity (we shall look at these concepts later) should be normal. Such company is considered as stable. Also it is considered such company can generate income from its activity.
  Other companies are somewhere in the middle between the industrial and commercial structure for optimum balance.
  Further, we together with you, dear reader, shall look at a few different models of the idealistic approach, based on the scoring analysis.
  
  2) The model of an ideal company in the industry: assessment based on scoring
  
  2.1) Model of the Financial Academy under the RF Government of an aggregate assessment of balance without pointing to any particular industry
  
  Let's look at this model in more detail.
  The model of aggregated balance sheet estimation involves splitting the balance on the quality of assets and liabilities, depending on the timing of their involvement or performance. This aggregation-splitting should be made prior to analysis itself.
  Aggregation occurs in 4 groups, as indicated in the footnotes . The very same model assumes V classes of indicators on the basis of this aggregation. I, together with you, my dear reader, will discuss the aggregation later in this paper in more detail. The rest of the calculation is based on the following table, created by the author of this paper so that you, my dear reader, could easily understand the complex model of Financial Academy under the RF Government:
  
  Table: Calculation model of the firm's aggregate assessment of the balance
  
  Table: Calculation model of the firm's aggregate assessment of the balance [Alexander Shemetev]
  
  
  Results of financial analysis by this method are evaluated according to the following table, designed by the author of this paper so that you, my dear reader, could easily understand the interpretation of the results according to this model:
  
  Table: A unified characteristics of the firm according to model 2.1
  Table: A unified characteristics of the firm according to model 2.1 [Alexander Shemetev]
  
  
  That is how it"s going - the company"s assessment following the model of aggregated balance model based on scoring approach without concentration on a particular industry. Now, let's look at the overall weighted average model of a financial analysis of companies by industry.
  
  2.2) model of financial analysis of companies based on industry standards
  
  Alexander Shemetev, the author of this paper, has calculated for you, my dear reader, the following model that estimates industry coefficients. It was developed by analyzing the average values of the coefficients for different industries, which are used by several different banks, as well as on the Alexander Shemetev's own designs for the financial analysis of Russian companies. It displays the average value (Ō) and the average deviation in the up or down (σ / 2). Let us now analyze the very important factors by the formulas used for the financial analysis.
  Table: Calculation of the major industries" coefficients of the financial analysis
  Table: Calculation of the major industries’ coefficients of the  financial analysis [Alexander Shemetev]
  
  
  Few words should also be said about the method to estimate the average value of indicators. Now, let"s see the average is calculated by the following formula:
   of indicators. Now, let’s see the average is calculated by the following formula:   [Alexander Shemetev] (45)
  Where: X average [] - is the average of a number (for example, the average value of figures: 2, 3, 4 is equal to (2 +3 +4) / 3 = 3 - this is the example of the very figure is denoted as X average []. Х1, Х2, ...., Хn - these are the components themselves, the middle of which we calculate (in our example n = 3, as the figures we have just 3: 2,3,4. Indicators of X are as follows: X1 = 2; X2 = 3; X3 = 4).
  The average deviation from the mean value - is an half of the standard deviation:
   The average deviation from the mean value – is an half of the standard  deviation:  [Alexander Shemetev] (45.1)
  This figure shows what is the most probable deviation from its average value can be so we should expect it. Now you, my dear reader, now: how these ratios were calculated and how the below matrix was calculated. Now, let's consider the basic norms of the coefficients of the main branches of economy.
  Table: The basic norms of the coefficients of the main branches of economy
  Table: The basic norms of the coefficients of the main branches of economy [Alexander Shemetev]
  
  Thus, the model, in general, focuses on two types of indicators: minimum (min) and normal (normal). The minimum average value suggests that the risk below this boundary is maximal. Normalized figures do not bear the critical information and have no critical values in relation to risk. They are rather refining indicators of financial analysis. The average deviation (σ / 2) shows how the ratio value may deviate among individual firms in the industry under the normalized distribution of risk. Value of the index (Ō - (σ / 2)) below a critical risk to an individual company suggests a critical risk for it.
  Let us conclude the idealistic approach to company"s financial analysis at this very model, my dear reader. I together with you, dear reader, shall discuss the industrial specific features of companies inside the industries in the chapter of my future book devoted to complex financial analysis of companies at the expense of marketing (now it published as a paper in English). In the meantime, let's move on to a comprehensive financial analysis of business systems today.
  
  
  A comprehensive financial analysis of companies
  In the modern Russian conditions
  
  You will, probably, may ask me: "What is difference between a comprehensive financial analysis and non-comprehensive financial analysis?" The main difference lies in the analysis of companies on the elements of its activity.
  A comprehensive financial analysis tries to establish the true state of affairs in the company on individual elements of the company activity: the overall financial "health"; financial stability; liquidity; stability of relative financial performances; financial results of business-activity; profitability and business activity. The complete scheme of comprehensive financial analysis of companies is represented in the diagram below:
  
  
  Scheme: a comprehensive financial analysis of business-systems
  
  
  Scheme: a comprehensive financial analysis of business-systems  [Alexander Shemetev]
  
  
  The diagram shows that the knowledge about a company lie in a comprehensive analysis of areas of the business-system"s activity; at the same time, the analysis must be periodically updated to keep abreast of the latest developments in the firm. Now, let's look at what the data is taken for a comprehensive financial analysis. All data types can be divided into two groups: the reporting and production. The classic financial analysis is based on accounting-reporting data, those that can be obtained from the accounting department, above all, the final report forms themselves, well, for big specialists and for more private-analysis - the accounts of which they consist.
  If a company is small, then analyze the accounts will be significantly easier than when the company is very big. Because of this fact, there is a wide using of standardized financial statements for the purposes of financial analysis. All of this leads to the fact that items of property shall be registered not on fair price, and as if by a "dirty" book value. Because of this fact, the data of Russian accounts are not peeled, it's kind of gross data. I say this in advance to ensure that you understand that the financial analysis in Russia is radically different from the financial analysis using GAAP or IFRS.
  These features we consider later. In the meantime, let's move on to complex financial analysis. First in this section, I describe the general types and kinds of financial analysis, and then I proceed to consider the elements of financial analysis. After this, there are some aspects of financial analysis. So let's start.
  There are many different types and kinds of financial analysis. The first thing I discussed with you - is that it can be rapid and normal. However, if you get even more generally to financial analysis, I should also mention that it can be vertical, horizontal and systemic.
  Horizontal analysis - it is a time-based study of business-system based on the comparison of the elements and items of property of a company. The comparison is provided with the similar periods in the past and in the forecasted or predicted future. This analysis is usually supplemented by some data on relative performance (growth rate, growth trends, indicators of the structure for years, ... ..). The purpose of horizontal analysis is to identify trends and changes in the company for creating a reasonable scenario for the future operation of company.
  Vertical analysis - it is a structural-and-factor study conducted in a single slice of data to identify the structure and values of individual elements of the company's property. The main tool of vertical analysis is the indicator of structure or financial coefficient. Financial coefficient - is a relative measure, which reveals the essence of any kind of process or phenomenon in a separate line for subsequent decision-making and analysis of this process.
  Sometimes they outline a systematic analysis - it is an analysis of the company on the vertical and horizontal analysis at the same time, - so that the analysis is an integral whole. For example, if we broke the records of several companies on many different factors and parameters, then began to analyze them in a 5-year period and to build forecasting scenarios for individual companies and the industry as a whole, this is an example of systematic analysis. Thus, systematic analysis examines both horizontally and vertically at once a whole complex of firms in terms of absolute (numerical) and relative terms for a certain period of time.
  Another special type of financial analysis is the stress-testing. This is a new term that appeared in Russia recently. The above concept was born in the United States in the 1980s. Stress testing involves modeling scenarios for the company. I"ll get to know you, dear reader, with stress-testing in more detail a little later. And now let us return to the consideration of the classifications of financial analysis.
  Another important basis for the financial analysis is the tool that is used in the analysis. This classification is so important, that it served to divide the financial analysis within the chapters of my Russian book devoted to it. For example, if it is applied only financial and economic reporting for investigating by coefficiental or linear (trend, horizontal) method, this analysis will be a classical financial analysis of companies, which is to be conducted at the expense of economic and financial instruments.
  At the same time, such a financial analysis has several limitations.
  First, it is narrow enough in the activity specific: it is a lagging indicator of the company, at least, because statements are not prepared each day, and many problems are assessed by indirect signs (such as problems with sales are seen through the prism of inventories, accounts receivable and payables, and sometimes through the prism of borrowed funds) ... .. Also, this approach focuses on the internal state of the firm"s affairs, and it, for example, is poorly-oriented for estimation of company's marketing position and prospects of development as well as market segmentation. In other words, this example reveals that this kind of analysis is poorly oriented for the comprehensive analysis of company"s environment and so on.
  Second, this analysis focuses too much on the values that can be clearly expressed in the money, and this kind of analysis suggests that these are the values that will be the basis for the revenue and income generation from ordinary activities in the future.... At the same time, there are some innovative companies that can give odds to big industrial wisent-bisons in terms of revenue and profit. The success of such-like companies can"t be explained by means of classical financial analysis.
  There are other shortcomings of classical financial analysis - I will not make a listing of them. I should note only the following.
  A person who knows how to use a good classic financial analysis is very similar to a surgeon who can work well only with saw .... This is especially true about individual sub-categories of people: those who know how to use a rating approach (similar to a surgeon, working always only a chainsaw), those who know how to use only the rapid analysis (similar to a surgeon who knows how to work by several saws), and those who can apply only comprehensive financial analysis, ... ..
  All this does not mean that people should immediately stop to use the classical financial analysis - not at all! If you refuse to use it, my dear reader, your competitors will use it in the better way than you do! They will then be able to become more effective in matters of saving money than you, and such a fact will not end good for your company in the end.
  Now, let's look at the other prisms through which you can conduct a comprehensive financial analysis. Of course, the prism of modeling can be stressed out immediately. The next methodologies can be used when conducted an analysis through this very prism: the methodology of stress testing for companies; wait-if analysis ; simulation and other similar approaches. One should also note the marketing prism of financial analysis, which conducts financial analysis of companies without the separation from the surrounding environment, especially, from customers. There should also be noted the management prism of financial analysis, through which one is able to distinguish the effect of the management components of the company. It should be noted also the prism of IFRS and GAAP, financial analysis through which differs from ours. There should also be noted the prism of corporate culture, through which one can well appreciate from financial side the companies from services sector. I should also highlight the market prism, through which you can actually assess joint-stock companies, in particular, from the spheres of immaterial production. And so on.
  Financial analysis will be different in dependence on the selected prisms. I"d like to note that the partition of types of financial analysis depending on the prisms is the author"s know-how, which considerably expands the range of financial analysis of companies; and such partition makes financial analysis applicable to all companies regardless of industry, activity specific, the use of optimization transformations of company"s , the region and so on. All of this implies a large section of financial science, the complex financial analysis.
  Now, let's move on to the classical financial analysis of company.
  For beginning, let's look at the balance sheet, the basic document which serves as the basis for a classical complex financial analysis.
  
   For beginning, let's look at the balance sheet, the basic document which serves  as the basis for a classical complex financial analysis.  [Alexander Shemetev]
  
  As it can be seen from the scheme , the balance sheet consists of two parts: assets and passives, among which there is the sign of equality, it is not by accident. The very name of "balance" means "equality" (balance sheet - is from the Latin "Bi-lanx" - equal scale dishes). Assets - are the company's resources, which are used in production. At the time, as passives - these are the exact places the resources were taken out from. In all disciplines there is a conservation law, which states that "nothing can appear from the nowhere and then disappear back into the nowhere!"
  There is the same thing in the balance: nothing is taken out of nowhere to be then disappeared into the nowhere. Although in practice, sometimes it happens, and that's another story.... So, let's take the dishes of balance in more detail.
  Let's start our conversation from the source of funds, from passives. Logically, passive earns no money - it only takes them: a firm have to extinguish the debt owed to creditors: banks, individuals, ....; to extinguish the debt owed to participating shareholders; it must still pay payroll to staff; ... .. All this, as you, dear reader, can guess does not directly add the money... Passive (the same word for liabilities) does not generate income - it only takes incomes and generates expenses! At the same time, a company can"t work without passives! In the end, where it will take its resources from? And here there is the issue price of capital ... You, dear reader, may ask: "And how much is for the capital of the organization?".
  To answer this question, the author proposes to consider a model of the weighted average cost of capital . This model is widely used in the world today.
  This model can be applied to next organizational forms of companies: Company Limited (Co Ltd); Company with additional legal liability (CWALL); closed kinds of public corporations ; unitary enterprise; close corporation as well as even for IEs (Individual Entrepreneurs). This is easily calculated by the following formulas.
  The weighted average cost of capital for such companies (Co Ltd; CWALL; public corporations with shares no quoted at market; unitary enterprises; close corporations) is equal to :
  WACC= d OC(Eq) * r OC(Eq) + d TL * k%* (1 - Т) (46)
  The weighted average cost of capital for public corporations with quoted at market shares is :
  WACC= d TL *k% *(1 - Т)+dP*rP+dS*rS (47)
  Average cost of capital is also necessary to use quite carefully, because the cost of equity is usually measured subjectively. This is due to the subjective evaluation of the rate of return on investment - every business owner and investor has it different for each economy sector. Besides, there is quite a big arsenal of different methods of estimation the norm of return on investments for each particular case. However, you can take a minimum rate - the rate of capital depreciation, it is equal to the minimum value of inflation in the country.
  If the rate of return on investment is more or less subjective, the cost of debt - is not. It is considered as follows. Let's look at an example.
  Let a company has 6 outstanding loans at January 1, 2011:
  1) Credit of Bank "? 1" in the amount of 25,000 USD for 7 years at 26% per annum including commissions, from July 1, 2006;
  2) Credit from individual entrepreneur whose surname is Mr. Petrov in the amount of 16,000 USD for one year under 40% per annum from September 26, 2010;
  3) Loan from Bank "? 2" in size of 60,000 USD for a period of 8 years under 32% per annum including commissions, from October 8, 2008;
  4) The loan of Co Ltd "Progress" in 12,000 USD for a period of 2 years at 35% per annum from May 26, 2010;
  5) Loan from Bank "? 3" in size of 74,000 USD for 9 years under 42% per annum, from November 21, 2007;
  6) Loan from Bank "? 1" in the amount of 52,000 USD for 10 years under 36% per annum, from April 4, 2009.
  Under the given conditions, the weighted average price of the loan can be determined by one of two methods: using the approximated rates (simple approximate calculation) method and the exact rate (adjusted exact calculation).
  1) The method of simple approximation
  
  
  The formula for the approximated rate is as follows :
    The formula for the approximated rate is as follows [Alexander Shemetev] (48)
   For our example, the average rate on loans under this procedure will be:
   For our example, the average rate on loans under this procedure will be:  [Alexander Shemetev]
  This result - is the approximated cost of borrowed funds for this company. This is a very simple calculation method, because it does not pay substantial attention to the debt repayment schedule, which can adjust this percentage somewhat. For more accurate analysis, the author recommends you to use the proposed and created by Alexander Shemetev models, that can more accurately calculate the average cost of capital.
  2) The method of streaming approximation
  Author for a more accurate calculation offers you, dear reader, to use a sufficiently mobile and simple, and at the same time, a fairly accurate formula for calculating the price of debt. This formula was developed by the author of this paper. The formula is as follows :
   Author  for  a  more  accurate  calculation  offers  you,  dear  reader,  to  use  a  sufficiently mobile and simple, and at the same time, a fairly accurate formula for  calculating the price of debt. This formula was developed by the author of this  3 paper.  The formula is as follows : [Alexander Shemetev] (49)
  For our example, the rate on the loan will be :
  
   For our example, the rate on the loan will be :  [Alexander Shemetev]
  
  
  In this approach, measuring the return time in days of getting the loans back is not required, because you want to know average cost of capital for today, knowing that tomorrow it may change; and the goal is to find out how much is the average debt capital of the company today using simple calculations. The author will offer you, dear reader, the formula of method of exact interest rate calculation for the weighted average cost of capital.
  3) The method of exact interest rate (taking into account the implicit interest)
  This method, developed by the author of this paper, suggests that the negative cash flow of credit funds are flowing evenly. This is done to simplify the calculation and visualization. In addition, occurring-every-period-payments (so-called annuity) - is the most common form of bank loan today, because helps to "hide" the true interest of a loan. As it was seen before, the basic methods are not able to check and calculate the true price of credit resources, even approximately. In order to calculate the implicit interest on the loan and know the real interest rate, and, consequently, the cost of debt, it is necessary to use other models of computation. However, the model requires some mathematical calculations. In general, any occurring-every-period equal pay - it is a pure geometric progression, which has the form :
   However, the model requires some mathematical calculations.  [] (50)
  
  At the end of the first year, the company will pay an amount of C*(1 + i) in monetary units; that is, the amount debt body and the amount of interest in the i% per annum; at the end of the second year, the company will pay an amount of C*(1 + i) *(1 + i)= C*(1 + i)^2; .... and at the end of last year - an amount of C*(1+i)^(n-1). ^ - is a mathematical sign for power. Where: n - is a term of the loan repayment in years .
  Then the entire cost of funds, which the company will return to the repayment of outstanding debt will be equal to (when paid annually, and interest once a year - it is taken to simplify the calculations, because essentially, it does not change the calculations ):
   Then the entire cost of funds, which the company will return to the repayment  of outstanding debt will be equal to (when paid annually, and interest once a year  – it is taken to simplify the calculations, because essentially, it does not change the  3 calculations ):  [Alexander Shemetev] (51)
  
  It can be so, that we can not to know the future value of the loan (FV) for any reason. Therefore it is better to proceed from the known exactly data: Therefore it is sometimes better to proceed from the known exactly data: the amount initially granted funds (PV) , which is calculated as follows:
   It is sometimes better to proceed from the known exactly data: the amount initially  1 granted funds (PV) , which is calculated as follows:  [] (52)
  
  If then, as we know how FV is calculated, let us derive the value of the annual payment on the loan with interest from the formula:
   If then, as we know how FV is calculated, let us derive the value of the annual  yment on the loan with interest from the formula:  [Alexander Shemetev] (53)
  This payment is equal to (54):
   This payment is equal to (54):  [Alexander Shemetev]
  This is a kind of mathematical expectation of amount of this payment, when the interests are calculated and paid one time per year. In case, when payments are more often, instead of i per year, you should put i per month (or other period), which is equal to 1/12 in the case of every-month-payment. The n number then will be the number of such months or other periods of payments. The other kinds of mathematical expectations of payments and some other questions are outside the scope of this paper.
  This is the average value of negative cash flow, which a separate company will pay annually on the loan. In general, this formula can be used to calculate the true interest of an annuity. The author of this paper has another book called: "Anti-crisis financial management Self-Taught book for commercial firms" directors and business-owners", issued in 2009. In Chapter 7 of this book, on page 309 and further it is written in a simple form with lots of illustrations - the issues on how to calculate the interests on credit agreements. That is why the author of this paper will not return back to the detailed discussion of this topic. The author tells only about financial analysis in this paper, including the analysis of borrowed resources and the cost of borrowed capital for a firm.
  Analysis of annual payment by credit resources is needed to be made in comparison to what would be the annual payment on debt, if we do not pay interest and so return the debt on equal shares - the difference is the price of credit usage, that is, the average interest rate on the loan. For the individual loan, average interest rate will be calculated using the formula:
   For the individual loan,  average interest rate will be calculated using the formula:  [Alexander Shemetev] (55)
  
  It should be noted that this formula calculates the hidden interest in credit, in particular, actually paid each period. The average interest rate throughout the whole loan capital of the company will be:
   It should be noted that this formula calculates the hidden interest in credit, in  particular, actually paid each period. The average interest rate throughout the  whole loan capital of the company will be:  [Alexander Shemetev] (56)
  
  For our example, the average rate on the loan would be calculated similarly. Final totals for the calculation of the above-mentioned indicators are given in the table below.
  Table: Actual interest rates on loans
  Table: Actual interest rates on loans [Alexander Shemetev]
  
  It should be noted that under the value of WACC (i) in the table, it is meant not so much the entire cost of debt capital, as the average price of credit resources to use (i). It should be noted that in the spreadsheet - there was taken not the average annual payment on the loan in relation to average interest-free loan rates, but the entire amount of payments for each loan in relation to the entire amount of funds originally made the loan agreement, understanding that the total percentage will not change (1 / 1 - is the same as that on 7 / 7 8 / 8, 10/10 and so on!). The general formula for calculating the WACC for setting the cost of borrowed capital (i) will remain unchanged.
  (i) - is the amount of actual annual interest for credit resources usage, including "hidden" interest leveled and aligned as if the interest is calculated once a year (it exactly corresponds to the norms on loans according to the Civil Code of Russia, in order to avoid the lender"s "unjust enrichment"). Negative cash flows are taken in total for the year for each loan, knowing that the loan repayment schedule for the year will have no effect by the amount of credit repayment during the year (there is no difference to account: 300USD at the year-end, or to give 100USD at the end of each 4-th month - at the end of the year there will be the same amount in 300USD). The specified total amount of payment in USD company will repay in equal installments on a monthly basis or annually - there is no difference - the averaged sum for using the borrowed resources was taken.
  Monthly payment can charge more implicit interest (which will not make a significant impact on the external cost of capital). The average percentage for the use of borrowed capital can be calculated more accurately using the following formula (% calculation corresponds to the Russian Federation Civil Code / RFCC / at an annualized rate, thus, it takes into account the term of use of credit resources with each-month-updates - after the next payment on it).
  For the beginning, let's remember that this is the same geometric progression, as it was in the previous case. Let the company pays the loan several times (X times) during the year: if monthly, then X = 12, and if a daily basis - then X = 365. Accrual of interest shall not exceed the standard rate stated by RFCC on declared annual interest rate validity demand. Then, at the end of one year, the company will be obliged to repay the loan С/Х*(1+i)1/X; by the end of the second year there will be an amount in С/Х*(1+i)2/X; and so on. Please, look at the formula (52), which is a little earlier in the text - it describes the relationship between the amount of credit granted (PV) and the sum of all payments made by it (FV). The sum of all payments on it - this is the same geometric progression:
  
   The sum of all payments on it - this is the same geometric progression:  [] (58)
  
  Let"s back to our formula (52) and let"s substitute the resulting value:
  
  
   Let’s back to our formula (52) and let’s substitute the resulting value: [] (59)
  
  Let us, dear reader, now calculate the total payment for such credit (let"s denote (1+i)1/x= ω)) (60)
   Let  us,  dear  reader,  now  calculate  the  total  payment  for  such  credit  (let’s  1/x denote (1+i) = OMEGA)) (60)  []
  The average interest cost of the loan, including the hidden interest is:
  
  
   The average interest cost of the loan, including the hidden interest is:  [Alexander Shemetev] (61)
  
  And the average cost of debt capital (%) is as follows:
   And the average cost of debt capital (%) is as follows: [Alexander Shemetev] (62)
  Dear reader, please note that this is the net price of credit resources, including hidden interest. However, it should still be reduced by the amount of tax leverage, because the cost of the loan should be attributed to costs. Tax leverage is calculated as number (57) formula as (1-T), where T - is the amount of corporate income tax, depending on what tax regime it applies.
  The discount rate on equity calculation - is more than a simple calculation. I recommend you take the minimum bid in the amount of inflation or similar value plus a risk premium. Summing up this component, you will receive the value of the interest rate at i% per annum. This is the cost of equity capital in the year.
  I"ll be back to talk about how to calculate the cost of capital (inflation, devaluation of money, risk-free % rate, the risk premium and so on). With any method of calculation - this is a fairly simple calculation. It is easier still because there is no need to accurate records of actually occurring adverse cash flows that arise, inter alia, during the liquidation of debt in different ways.
  The market price of long-term credit, unfortunately, is still very high, and it can also be unnecessarily risky to take short-term loans, notwithstanding their price is much lower - it is almost always equal to the declared value of the loan (it only additionally plusses the more cost commissions, which are also to be announced).
  If the costs of short-term loan rates are actually higher than it was advertised - you should know, that such practice is banned by the RFCC, and you can get rates" reducing by legal means. At the same time, the long-term credit (over 1 year), credit institutions may make a totally "legal" stuffing of hidden interests into the credit products.
  I have deliberately started the section about the balance from the story about how much is it for the capital that the company attracts and how much is for the company"s equity. This is a key aspect of the functioning of any business. Can you tell me, how one can conduct financial analysis, while not knowing the general cost of company"s capital: both equity and debt capital?! The cost of capital - is the main indicator of company activity effectiveness and also it is the main indicator of the time-term which the company can stay at the market. It is possible that your company works primarily on your creditors, and what is rest after paying to them - is yours (of course, if it works for you at least any time)!
  For example, if cost and price of equity capital for the company, which we have already taken as an example is 15%, the volume and the relative amount of debt is equal to 40% (respectively, their own funds are equal to 60%), and the tax rate is 20%, the average cost of capital (the total value of WACC), if a company, say, Co. Ltd., is:
  WACC= d OC(Eq) * r OC(Eq) + d TL * k%*(1-Т) = 60%*15% + 40%*28%*(1-20%)=17.96%!
  
  At the same time, it is important the theoretical value of WACC, which is based mostly on the cost of total theoretical value of the borrowed capital for the business-system. I will try to explain my concept by using the following scheme:
   At the same time, it is important the theoretical value of WACC, which is based  mostly on the cost of total theoretical value of the borrowed capital for the  business-system. I will try to explain my concept by using the following scheme: [Alexander Shemetev]
  That is why it is important to assess the cost of borrowed capital (liabilities (TL)) in different parameters in exact values, because these are the obligations firm is needed to fulfill not to become proclaimed as bankrupt. According to law, bankruptcy, in simple words, is an inability of debtor to cover its liabilities to creditors above the stated by law sum of debt, plus there are some other formal conditions. And that is why the cost of equity sometimes can be expressed in its minimal value, for some kind of companies.
  The total mathematically expected cost of capital for the whole prognosis period will be:
  WACC= d OC(Eq) * r OC(Eq) + d TL * k%*(1-Т) = 60%*15% + 40%*189.4%*(1-20%)=69.6%!
  This is the value that company needs to cover in order to stay afloat. The generating of this amount in every reporting period will allow to this company both to meet the needs of owners and investors by its phenomenal average annual profitability.... It is true, that there are only very few companies in the world today that have such a high actual return on capital in a year!
  28% was taken as the minimal rate. At the same time, in Russia the cost of borrowed capital can be 70% per year (effective rate) - which is much higher than the figures in our example. At the same time, there is no legislative regulation for the overdue credit payments interest rates - it makes them extremely high in Russia - far above 150% per year, which makes returning of debt almost an impossible enterprise for companies with financial difficulties. That is why in Russia banks feel themselves better when crediting the insolvent companies, when it is exactly known that the company has no opportunity to pay the debt in the future.... And this is another story which is outside the scope of this paper. For insolvent companies it is normal to have the WACC for debt capital above than 150% per annum, which makes the total WACC usually at the rate of 50 - 80% per annum. And this is also the reason of their bankruptcy - and this is also another story which is outside the scope of this paper.
  Because of this fact in Russia today, financial leverage often has a negative effect - this is normal.
  Also, the situation when the cost of capital is not accustomed to be estimated (especially the borrowed capital with all the hidden per cents) makes the financial policy of Russian domestic enterprises subservient to any crisis changes in the external environment. After all, in fact, companies often operate mainly on their creditors.... And when there appears a crisis, the relatively meager incomes of such companies become much more meager in relation to the incomes of their creditors, at the same time when nobody cancels the repayment of debt to company"s creditors - in such situations there is preserved the urgent need to pay them.... And here there is a stagnation of the financial cycle, which we mentioned earlier. In the event of a crisis in the financial cycle, all attention should be paid to it, because that is the main cause of bankruptcy of companies at home and abroad - these are the problems with creditors.
   In the scheme we were talking about a crisis bifurcation explosion of the environment, which leads the company with very cheap borrowed resources immediately to the crisis of the financial cycle, which can cause a rapid failure of the company (investors, they are also shareholders / in the west it is - the most common form of company / may more aggravate the situation by starting to sell shares on the cheap, of the company that is so quickly getting into the crisis....!
  All this happens even in the west, where the loan capital, on average, is significantly cheaper than in Russia; all this in the times of crisis causes the whole chain reactions of bankruptcies of big companies.... and then what one should say about Russia, a country with relatively more expensive debt capital....
  We have begun consideration of a comprehensive financial analysis from the source of funds, from passive. Passive, as you remember, does not make money - it just absorbs them like a sponge. At the same time, it is impossible to make money without it, because it - is the source of all the resources of the company. Now, let's turn our attention to asset!
  We started talking about the complex financial analysis with the most important types of analysis: how much is for the entire capital: own and borrowed. Now, let's assume that everything is in order with the cost of capital, or vice versa, not in order, and we begin its comprehensive financial analysis in accordance with the previously given by me scheme of stages of complex financial analysis of the business. Why we return to this schema? The fact is that the asset analysis - is an analysis of how the company makes money. Also it reveals whether a company uses its passive in a rational way or not (it does not make a sense to consider assets separately from passives).
  I need to say few words why I often say passives and never say liabilities instead. The case is the term passive is broader and more appropriate for it. Passive is the sum of liabilities plus equity, which is equal to the total assets" sum - it makes the balance of sources and placement of these sources.
  Asset - is a generator of revenue. The assets contain all the means by which the company makes money: the money itself, the production facilities, lines, structures, raw materials and material assets in production and in storage; finished products which is already paid or will be paid later, and so on. Please note, that the received money for the paid production and other received money go through the series of accounting...to be then poured into a designed asset.
  Although the official account says the assets and liabilities-passives are always equal, however, the bankruptcy of firms often comes from the fact that management cannot properly separate some asset from a liability - these items of accounting are often considered as assets, the so-called "passive assets" - assets that do not bring real income of their owners. In return of it, the "passive assets" can do it "in theory" and therefore they "hang" in assets.
  An example of a passive asset may be, for example, a just placed account receivables, which is classified as "good", but is actually a "bad" one, because the firm entrusted with the obligation to pay is actually slightly solvent. Another example of such an asset may be an obsolete just for 2 years production line, the amortization period of which is 20 years - it can no more produce competitive products for today's time, while it "hangs" in the balance.
  Thus, the most important goal of financial analysis - is to find out the cost of capital on which assets are operating, and to know how to divide the assets of the active from the "passive" assets! The more passive assets you will be able to identify and get rid of them in return of active assets - the more modern is your company and so much more successful it will be.
  Because this fact, the cost of capital - is one of the most important factors that shows the actual stability and success of the company....
  Now let's consider the first component of our scheme for financial analysis: common analysis of financial performance.
  
  Common analysis of financial performance
  How to make a common analysis of financial performance? It is enough to have just a balance sheet for this step of comprehensive financial analysis. Scheme of the general analysis is as follows:
  Table schema: Overview of the financial condition of a business-system
  
  Table schema: Overview of the financial condition of a business-system [Alexander Shemetev]
  That is how it looks like: the comprehensive common analysis of financial performance. In general, for this analysis you, dear reader, need a pen, pencil and calculator. Even better - if you have the possibility to use a computer - it will significantly speed up the analysis. For example, you can use a widely-used common Excel program. In lines 2 and 3 include data from the balance sheet accounts or from primary accounts if the balance is not ready, or if you want to audit. Approximate balance accounts of each line are given in line 11 - these are the account numbers that you, dear reader, can ask for accounting inside a company.
  The purpose of the analysis is to identify the structure and dynamics of business-systems development in space and time. To learn how to make forecasts of the company development - this is the topic we shall discuss after considering the theory of financial analysis.
  What advices can be given for the comprehensive common analysis of financial performance?
  In the assets - there should be allocated and analyzed indicators of the shares of stocks and finished goods in warehouses, as well as accounts receivable, especially in long-term periods, because the higher the potential age of receivables, the lower the likelihood that you will give them back, or that they will be returned in full volume. These figures reveal problems with the glut and overstocking in the organization, as a consequence, there is a problem in the marketing and operational (production) cycle.
  Another important thing is to pay attention to the indicator of short-term investments and cash in the company: they should neither too much nor too insufficient (they should be over 2% of the total balance not to bear high risks) - otherwise one should reconsider the cash flow management policy in the firm, because it can show to a lack of effective management of cash flows in the business-system.
  Also, there should be paid attention to the structure of fixed assets in non-current (immobile) assets, as well as items of property, located in an unfinished construction in progress. It is important all the fixed assets should be in good condition - they shouldn"t be over-worn (obsolete); as well as there should be paid attention to the unused parts of fixed assets. The main objective of reforms in this area - is a more efficient use of this resource type.
  In the passives - there should be allocated and analyzed indicators allocated primarily as a long-term borrowing and short-term ones. The higher the level of liabilities in passives - the worse it is for the company, when the borrowed capital is much more expensive than the owned one (which is fair for Russia). Expensive borrowed capital may lead company to the state of insolvency and to procedures of bankruptcy.
  Any change in debt capital cost is a chain more pronounced change in the financial condition of business.
  There should be allocated accounts payable in the short term borrowed capital. Ideally the management can be built so, that company"s accounts receivable maturity would comparably cover the amounts of arising payments on accounts payable - this is an idealistic condition of the normal flow of credit process for the company.
  In the equity - there should be stressed out the shares of authorized, odd and reserve capital. All these - are three elements of the capital of first level, ie, sustainable capital. The mid-tier capital, between the first and the second, is the retained earnings, which brings stability to organization. At the same time, all the forecasts may not come true with this indicator in the future - so the future trends of retained earnings may not be met, that is, the figure shows only static without making a full surety about the future dynamics trends.
  Every trend in sections and articles of company property should meet a proper explanation to have an understanding of basic processes that occur in the company.
  This is not an end point of common financial analysis of companies. Along with balance, there is a parallel off-balance accounting.
  The general scheme of analyzing the operations reflected in the off-balance sheet accounting is as follows.
  
  Table: Total financial analysis for off-balance accounts
  
  Table: Total financial analysis for off-balance accounts    [Alexander Shemetev]
  
  That is how it looks like: the comprehensive common analysis of off-balance sheet accounts. Analysis of these accounts should focus on written-off debts of insolvent debtors. Analysis of this indicator is important in compiling statistics of returns of accounts receivable.
  The second thing you should pay attention to - is the dynamics of the cash flows from lease of fixed assets. Actually, leasing is always better than renting - rent may be increased, you can move ahead some "room" to be "thrown away" on any grounds, for instance, an owner may rise up the rental payment....
  In this regard, it is better to purchase fixed assets either immediately or on credit agreements, including mortgages, where possible. However, please, note that rental money under the contract is recorded, mainly, by large companies. The rest of companies can reflect rent money on contracts, and they may not to reflect it.
  Sometimes here even may be reflected some of the funds received through contracts of a different type, such as lease (usually there should be opened a subcode, for example, 912).
  A small digression should be made. Stagnant and temporarily unused parts of property, plant and equipment is recommended to rent, however, they are reflected in the balance in somewhat different. These objects are the fixed assets, if meet the criteria of recognition , therefore, the income from them is the company's revenue from the additional activities and is taxed.
  You should also pay attention to the lines of securing the liabilities: issued and received sureties and warranties, because it may eventually lead to certain payments in the future, which imposes certain risks in case of different events which may impose the company to pay its sureties and warranties....
  Now let us, dear reader, come to the following section: analysis of financial steadiness
  
  Analysis of financial steadiness
  
  Stability (steadiness) means a special ability to retain the beneficial properties in space and time. The companies have a special type of stability - financial. Financial stability - is a measure of potential ability for companies to maintain their critically important for normal functioning cash flows even in case of severe crisis changes in the external and internal environment . Opposite value to the concept of sustainability is the concept of "risk". The risk of loss of financial stability loss means by itself a probability of the company"s normal functioning destabilizing in time and space.
  In general financial analysis we have the two scales, weights corresponding to cups of balance scales: assets and passives. There the bowls were always equal.
  In the analysis of financial stability there are also two scale dishes: financial stability and risk.... And there are equal only what actually is put upon the scale dishes - the weights themselves; at the same time, the number and type of these weights as well as to which scale dish they are put upon - it all depends on the skills of company"s management.
  Generally, to determine the financial stability the financial analysis is needed.
  However, there are external signs of financial stability, which are the solvency and creditworthiness . If the company has already lost the first and second external criterion of financial stability, it speaks about a crisis inside the entity.
  Let's you and I, dear reader, consider how one can determine financial stability and the risks associated with its potential loss by means of financial analysis. We"ll look at a few theories:
  1) The classical theory of financial sustainability: sustainability assessment and risk
  There is the classic theory of financial stability, which says that the risks of financial stability loss, with a risk increase gradation, are: the amount of equity capital, the amount of fixed assets, the amount of long-term debt, the sum of short-term borrowings, and, most importantly, the amount of inventories and sum of costs. According to this theory, these five indicators reflect a sufficient degree of financial stability and risk of its loss for the company. Stability and risk analysis is as follows. First, there should be calculated the absolute indicators of financial stability:
  1. Availability of working capital (AWC /OMA - owned mobile assets sum/) - the net working capital of the company, which is characterized as the difference between equity capital (Section III of balance passive) and non-current assets (I part of the balance asset). The more a company has its working capital - the better it is for the company, and the more stable company is. The OMA growth in the dynamics shows positive trends for the company. The index can be calculated by the formula:
  
  OMA = OC(Eq) - ImmA (63)
  
  2. Existence of company"s own and long-term-borrowed sources to form the inventories and costs (PeMA - Permanent capital to cover Mobile Assets needs):
  It shows that permanent capital is sufficient to meet the needs of the organization. Permanent capital, as I mentioned, - is the capital with which the company can really work - this is the sum of Equity and Long-term borrowings. PeMA indicator shows net permanent capital of the company, which can be used for its development. PeMA is defined as:
  
  PeMA = OMA + LTL (64)
  
  3. The total value of the main sources of formation of inventories and expenses (TDFP - Total Development Funds" Potential):
  TDFP - is a measure of the total amount of funds that can potentially be directed to the development of the company and coverage of its current needs, such as stocks of raw materials. TDFP is calculated as follows :
  
  TDFP = PeMA + STL (65)
  
  For the calculation of financial stability, illiquid assets are deducted from each of these three indicators of financial stability. These illiquid assets show the "glut" of enterprise by raw materials, production in process and finished products, which speaks about the problems with the sale of the company - the classical concept testifies.
  Ideally, all three of the following indicators should remain positive. It reports that the stocks are under a fair share of the sources for their formation. This analysis indicates the sources, from which industrial activity is financed by: the intrinsic (ΔOMA), permanent (ΔPeMA) or mixed with borrowed (ΔTDFP).
  Accordingly, there can be stressed out the three indicators of inventories supply by the sources of their formation:
  1. Surplus (+) or lack (-) of working capital (ΔOMA):
  
  ΔOMA = OMA - Inv (66)
  
  2. Surplus (+) or lack (-) of own and long-term sources of supplies (ΔPeMA):
  
  ΔPeMA = PeMA - Inv (67)
  
  3. Surplus (+) or lack (-) the total value of stocks of the main sources of formation (ΔTDFP):
  
  ΔTDFP = TDFP - Inv (68)
  
  The above figures of inventories" provision by the sources of their formation can be integrated into a system of inequalities that characterize the type of financial stability:
  1. Absolute Stability:
   1. Absolute Stability:  [Alexander Shemetev] (69)
  It shows a good level of solvency and creditworthiness of the company. Such an enterprise is essentially independent from external sources of funds forming. However, absolute financial stability in Russia is an extremely rare phenomenon! In most cases, financial stability deviates from absolute!
  2. Normal stability, guaranteeing the solvency of the enterprise:
   2. Normal stability, guaranteeing the solvency of the enterprise:  [Alexander Shemetev] (70)
  It shows satisfactory level of financial stability. Such company has a normally solvency and creditworthiness. Such company uses borrowed funds in a rational way and it has a high rate of return from its core business.
  3. Precarious financial condition, it is characterized by a violation of the company's solvency, when rebalancing is possible due to the replenishment of sources of equity and accelerate the turnover of stocks:
   3.  Precarious  financial  condition,  it  is  characterized  by  a  violation  of  the  company's solvency, when rebalancing is possible due to the replenishment of  sources of equity and accelerate the turnover of stocks:  [Alexander Shemetev] (71)
  It shows doubtful level of financial stability. Such company is in crisis, and such company attracts additional borrowings for the crisis resolution. Under questionable level of financial stability, the company needs the anti-crisis development strategy for its withdrawal from the crisis and to restore its solvency and creditworthiness!
  4. The critical financial situation in which the company is insolvent and is on the verge of bankruptcy, because the main element of working capital - inventories - does not provide a source of their coverage:
   4. The critical financial situation in which the company is insolvent and is on the  verge of bankruptcy, because the main element of working capital – inventories –  does not provide a source of their coverage:  [Alexander Shemetev] (72)
  The critical financial situation shows the unsatisfactory level of financial stability. Such company is insolvent, and it isn"t creditworthy! It is necessary either tough anti-crisis restructuring of the company or its bankruptcy management!
  Exceptions to the rules: The classic analysis of financial stability shows only a general rule of financial analysis for the company. Dear reader, please have in mind, that there are cases when the company shows unsatisfactory level of financial stability, and it succeeds or it will be very successful in the long run. The simplest example of a successful company with this type of financial stability - is a company that in order to optimize the taxation system strictly separates its accounting and financial accounting. Also, it happens, that the negative analysis data indicates an "adventurous" enterprise or venture project, which in the future may bring profits to their owners. High inventories" levels and a significant amount of credit - are the typical features of venture capital (innovation) projects in the early stages of its life cycle!
  2) The Alexander Shemetev"s method of estimating the financial stability
  In this section the author of this paper offers you, dear reader, the developed by him financial stability comprehensive assessment methodology. The method is designed primarily for the analysis of financial stability, as part of a comprehensive financial analysis. It should be noted that this technique can be used as a rapid analysis of business systems
  Firstly, it should be overridden the fact what financial stability is, rather, what financial stable company is, because the study itself of financial stability does not carry a meaning and relevance, as the study of what a financially stable company is.
  So, financially stable company - is a company with the optimally-organized investment, marketing, operational and financial cycles, in ascending order of importance, which operates in such a way that the borrowed capital goes not to cover the lack of company"s effectiveness; financially stable company should have no problems with overstocking and moral-and-physical deterioration of assets, whose value is satisfactory; thus, financially stable company is a business-system both with satisfactory fair value and that has no development of financial bankruptcy processes on any stage: covert and overt financial instability.
  This is a slightly complicated definition. It sufficiently describes the notion of a financially sustainable organization.
  From the definition it is clear, that there are 4 stages of financial stability (FS): the absolute FS, satisfactory FS (hidden processes of bankruptcy stage); poor FS (the stage of financial instability) and catastrophic FS (clear (obvious) bankruptcy stage).
  Each successive stage of financial stability involves some features of the previous one. A company with poor FS will include features of a satisfactory FS, and the firm with a satisfactory FS will have some lines of absolute FS. So, let's move on to analyze the financial sustainability of the business-system on its elements.
  Absolute financial stability and financial analysis of the signs of hidden bankruptcy
  Absolute financial stability will be observed, if the firm has no signs of bankruptcy on any and all of it stages.
  It is necessary to derive a number of formulas and definitions. The most important indicator of financial stability in the market is considered by us earlier, when we considered such figure as WACC - weighted average cost of capital, - which indicates how much the company actually pays for the fact that it works at the market. The more the firm pays for the right to remain at the market - the lower will be its actual financial stability. However, the WACC formula should be somewhat divided.
  Like you, Dear Reader, remember, the weighted average cost of capital is calculated in the next way.
  The weighted average cost of capital for such companies (Co Ltd; CWALL; public corporations with shares no quoted at market; unitary enterprises; close corporations) is equal to :
  WACC= d OC(Eq) * r OC(Eq) + d TL * k%* (1 - Т) (46)
  The weighted average cost of capital for public corporations with quoted at market shares is :
  WACC= d TL *k% *(1 - Т)+dP*rP+dS*rS (47)
  If you immediately recognized these formulas - so - you carefully read my book. I am very pleased by your attention and your interest to the complex financial analysis of companies at the market - thank you for it! These formulas must be broken down into two components each: the weighted average cost of equity capital (WACC (OC(Eq))) and the weighted average cost of debt capital (WACC (TL)).
  The weighted average cost of equity capital for Co Ltd; CWALL; public corporations with shares no quoted at market; unitary enterprises; close corporations is:
  WACC (OC(Eq))= d OC(Eq) * r OC(Eq) (73)
  The weighted average cost of debt capital for Co Ltd; CWALL; public corporations with shares no quoted at market; unitary enterprises; close corporations is:
  WACC (TL)= d TL * k%* (1 - Т) (74)
  The weighted average cost of equity capital (the so-called shareholders" equity) capital for public corporations with quoted at market shares is:
  WACC (OC(Eq))= dP*rP+dS*rS (75)
  The weighted average cost of debt capital for public corporations with quoted at market shares is :
  WACC (TL)= d TL * k%* (1 - Т) (76)
  It was said earlier in this paper on the intricacies and specifics of the calculation of these indices.
  The second important indicator of the company is profitability, from which we take the most important indicators: return on sales and return on equity (total equity and debt capital).
  Thus, the profit margin is calculated as follows :
   Formulas 77 - 82 [Alexander Shemetev]
  The next factor of this group of indicators is the measure of proportion of raw materials and other similar values in the firm"s balance value:
                       The next factor of this group of indicators is the measure of proportion of raw  materials and other similar values in the firm’s balance value:  [Alexander Shemetev] (83)
  The next factor of this group of indicators is the index of the proportion of finished goods in the firm"s balance value:
   Formulas 84 - 90 [Alexander Shemetev]
  ReP - this is the reporting period in days. For example, for the year it is 365 days.
  It is also important to know the value of net assets, calculated by the formula :
   ReP – this is the reporting period in days. For example, for the year it is 365 days.  3 It is also important to know the value of net assets, calculated by the formula :  [Alexander Shemetev] (91)
  It is these measures that are designed to detect the presence of some hidden crises that may indicate the presence of processes which are the characteristic of the latent stage of bankruptcy inside a company. For a more visual presentation of this material, the author of this paper invites you to review the following table, which gives the aspects of evaluation of these coefficients.
  
  Table: Assessment of the financial stability of companies and the processes of hidden bankruptcy
    Table: Assessment of the financial stability of companies and the processes of  hidden bankruptcy  [Alexander Shemetev]
    Table: Assessment of the financial stability of companies and the processes of  hidden bankruptcy  [Alexander Shemetev]
  
  So, if everything is observed - the company has the absolute, perfect financial stability. However, this analysis is suitable primarily for internal observer of the analyzed company. You'll probably ask me: how to analyze a third-party organization using this method? And this brings us to a very important issue of the essence of complex financial analysis. According to the Alexander Shemetev, in connection with all of the mentioned above, financial analysis - is not only a study and evaluation of internal environment condition of company, in aspects of economic and risks" conditions, as is customary in the classical financial analysis concept. Financial analysis, according to my opinion, financial analysis - is a verification (in comparison with other companies of similar market segment or with the same indicators" value or trends) study of the atomic (individual) business-system in order to identify the hidden and open internal problems of the company and its market position in strategic planning and crisis management activities, which also depends on the position of the observer.
  Thus, we have figured out how to analyze a company from the inside. Analysis of third-party-company - in case of suspicion on the use of its other significant accounting policies and application of optimization transformations of financial statements - shall include the following adjustments to the financial analysis. First, an outside observer can be relatively accurately known only to a single price on equity for companies in the industry. This is the rate of return for investors to invest in this market segment, that is, the standard norm-like-value of return on liquid-funds-investment to a certain industry, which is enough to motivate the owners to preserve their activity in this economic sector. At the same time, the average price for the debt remains a question. In this case, to compare your company with a third party, you must apply not-accurate method of assessing the cost of borrowed funds, including the hidden interests, as it was shown earlier in this paper, and include the approximate, the approximation model, which were suggested by the author earlier, before the description of developed by him exact model of evaluation. It should be understood that the conditions for loans are everywhere around one in a certain area - the market of borrowed capital supply has a highly developed competition. That is why the hidden interest - calculated by using the approximation models - will not be different with a high rate of probability from those credit products, the information about which you may easily get to know always. The advantage of the approximation models is that the same calculation is regularly made by statistical and financial sectors to estimate the average and weighted average rates on borrowed funds in the market. That is why you can always learn the average cost of debt capital learn from the data of the Central banks of countries in which there are companies to be analyzed, from the state statistics bodies and respected financial periodicals. This is the rate that should be included to the calculation of the price for capital.
  If you want to know what is not approximated, and the true cost of debt capital for third-party companies, in this case, you will need to establish the average market price of borrowed funds. Then learn about the most common loan products for business (as represented by banks and commercial companies of this market segment (including, the terms and "price" for accounts payable)). Then you will need to know the real rate of interest on this loan products, which can be known by usage of the formulas given in the exact method of calculation of interest rates. Then it is necessary to compare: how different interest rates announced on credit from the average-market rates. You then need to raise or lower logically the average rate of payment for chosen by you for the analysis credit products and to identify the differences in the percentages on the basis of proportion. Identifying the proportion is carried out on the basis of the Basic Law of the proportions, which is expressed by the following formula:
   Identifying the proportion is carried out on the basis of the Basic Law  of the proportions, which is expressed by the following formula:  [Alexander Shemetev] (92)
  
  
  Where the P%, C%, H% rates we can compute in the result of market research ; rate X% - this is the expected value of the hidden market average interest on loans to companies under study in a certain industry.
  Let's consider an example. Let us suppose that the average price of borrowed funds to companies in the industry is 30%, and hidden interest is 72%. It was found by the market research of borrowed funds" supply. The Central Bank of a country found that the average price of debt capital for the economy sector, which includes the industry under study, is 36%.
  Then the expected value of the actual, including the hidden interests, average market interest is:
   Then the expected value of the actual, including the hidden interests, average  market interest is:  [Alexander Shemetev]
  You probably ask me: Why we equate the expected value of the average market interest to the real interest rate? All the advantages of the WACC theory as a theory of weighted-average-cost-of-capital"s determining is estimated that: no individual items of capital (from the "seething cauldron of property") are included into a comprehensive analysis - instead of it is better to estimate the total capital as a whole, the WACC concept says. It is fair, because there can be a wide range of elements that can be included to into the total capital of a big company, literally, there can be millions of such-like single elements. And it should be understood, that it is a hard task to be done if to analyze all these millions of components. Even the modern neuron-computer-nets can hardly deal with this. I think, I should mention that simple analysts can"t do it in double. It would be a hard task to do that would require joining together the forces of programmers, financial analysts and computer networks.
  And now, dear reader, please imagine: the credit market for the segment of the market .... - it consists of hundreds, sometimes thousands, even hundreds of thousands of individuals, lenders, who are willing to give part of the funds as a certain debt to the debtor under certain conditions. Some of these companies that give loans - are banks - and some - are just entities that in different ways both sell their products directly and borrow money under certain conditions....
  When accurate assessment of each of these components is difficult even to neural networks, what is the talk about the identification of implicit interest at average credit markets?
  Moreover, any assessment of the actual percentage of long-term borrowed resources is always reduced to the calculation of the mathematically-expected-value, which, on the one hand, precisely assesses the expected rate, and, on the other hand, the actual percentage is likely to diverge from the expected, although the mathematical models can predict the lending rate expectation value with high accuracy.
  The problem of determining the cost of capital for companies is not limited to the assessment of the credit market and the average percentage on it, - it comes down to assessing how much is for the very existence of the company itself. In this case, especially when we talk about evaluation of a third party, there one can put a question of always incomplete information, which is closed to third-party appraisers for many objective and subjective reasons.
  And here it comes to the aid the theory of average cost of capital, WACC. It is taken the average cost of capital, which accurately considers how much is for the existence of the company in this market segment. Especially one should pay attention to the weighted average cost of debt capital for private companies. It is important due to the fact that the WACC (OC(Eq)) norm incudes in itself (it should be so) the calculation of depreciation, the depreciation of capital , which includes the average rate of return on investment.
  The borrowed capital - is an element whose value consists only of direct costs incurred by a single company in the market. If the cost of debt is so high that the company operates in the market for its creditors, there is definitely need to change something, well, or to gloat - when it comes to evaluating third-party competitors.... It is so, because it is - not even the first, the latent bankruptcy stage, - this is a stage of explicit financial bankruptcy.
  At this stage the company can apparently maintain a high credit standing and ability to pay for many years, and, at the same time, its owner for many years may actually be a "minus-millionaire", ie, to be an owner of debts in a net form of his or her capital, the debts which will have to be paid....
  This is the way how the most part of "minus-millionaires" appeared. Among them, there such famous people as: Adnan Khashoggi (he was even one time one of the richest people in the world, and then, he became a "minus-multi-billionaire", Jacques Boyrel (he was a very big multi-millionaire in the minus in his time), Ruiz Mateos (who was one of the richest men in Spain), John Bloom (production of household appliances magnate in the past (an independent inventor of washing machine)), Jim Slater (former owner of "Slater Walker"), Fred Laker (formerly aviation-magnate), John de Lorraine (auto-magnate in the past), Kate Hunt (former successful speculator in futures, founder of the transaction to "bet-index "), William Stern (former construction magnate), and many others ....
  It was so even a 100 years ago: this is how it went: the company were bankrupted by the same reasons. It was the time, when one of the firsts "minus-millionaires" appeared. Among them, there were such famous people as: Isaac Fridlender (agricultural and stock magnate in the past, Mid. of XIX century), Joe Leiter (another agricultural and stock magnate in the past, End of XIX cent.), and others.
  For all of these companies at the time WACC, particularly, WACC (HCC) has become negative, while maintaining profitability at first, then the external solvency and creditworthiness and then ... ... It is because the analysis of financial stability indicator WACC should always keep an eye on! !
  Now, let"s back to talking about a third party evaluation by using this method. In the event that, like in the Russian reality, a firm uses optimization transformations of financial statements, then the value of operating profit may be understated. In this case, it is the indicator of the standardized accounting that should help you, my dear reader, in this case. That is the industry average rate of return and other indicators, that are discussed in the paper devoted to comprehensive financial analysis through the prism of marketing cycle.
  You, dear reader, probably, keep in mind a question: How to find the weighted average cost of debt capital of the company, its components, the average % for credit resources, at a third-party organization at a lower analysis-expenditures without conducting market research?
  Such an analysis can be performed as follows. The price of capital is expressed through the indicator of % payable in the profit and loss account. If this value is divided by the amount of lines 510, 520, 610 and 660 (in the Russian accounting), you get the expected relative amount of funds to pay for credit debt, whose price is expressed in interest calculations. In this case, the hidden interests will be calculated to the sum of lines 510 and 520, and this is unlikely the hidden interests to be calculated to the lines 610 and 660. Mathematically, this operation is the calculation as follows :
   Mathematically, this operation is the  1 calculation as follows : [Alexander Shemetev] (93)
  This is the theoretical value. It allows us to give some idea of the credit processes that occur within the third-party company. However, if you rate your competitors, dear reader, you will be able to use the above formula (92) to calculate the implicit interest and their expected value. In this case, the expected value of the P% rate you can take without using the method of market research - you can make it directly from the balance sheet of each individual company. Then, you should expect the default charge of implicit interests to the lines 510 and 520. Thus, one can build a fraction to know the expected true value of these balance sheet items, and after - of the entire debt capital of company.
  This is a fairly easy procedure, because not all the companies have the resources to conduct comprehensive market research, and also their very conduct may be not justified for other reasons.
  Those who carefully read my book and looked carefully at the formula, you probably noticed there a β ("Betta") component, which is added to the funds remaining in the 070 code in the profit and loss account. This is due to the specific accounting of borrowed funds in the Russian national accounting.
  The fact is this is due to the fact that there is a limit, which a company can attribute to the cost from interest payments on credit agreements. This limit depends on the Russian Central Bank (CBRF) refinancing rate. This rate leads to a maxim standard rate that can be attributed to the expenses. This rate varies from year to year. Previously, it was equal to 20% now, and since 2011 it was planned that it will remain somewhere below the 13% level. The refinancing rate will hardly be more than 10% in the 2012 beginning. That is why the most what can be written off on such costs from interest payments on loans - it will be around 15% per annum - and the rest - is beyond the norm. The maximum norm is refinancing rate plus 50% of the refinancing rate.
  You, dear reader, may ask: How can it be considered? First, the funds for loans are typically collected at 66 or 67 accounts. Is the refinancing rate is, for example, 7.75% - consequently, the maximum sum that can be written-off to 070 line (to expenses) is 11.62% (it was circa fair for Russia in 2011; for 2012 beginning it is 12%).
  Next it will be necessary to build the value of a linear mathematical expectation.
  The average value of short-term loan in Russia is 36%, and long-term - is 32% (beginning of 2012). Please note, that the Bank of Russia (CBRF) gives significantly smaller average credit rates. CBRF data is 8.6% at the end of 2011 (for non-banking private entities). Most often banks in the Russian Federation issue loans in 21.4% and 31.4% per annum, and even in 41.4% per annum in practive (including commissions)! That is why you can use the author's data in 32% and 36% (although for some sectors, such as agriculture or the banking sector, it is possible to use cheaper credit products), or you can use your own data on average market prices for loans. The process of linear mathematical expectation of borrowed funds cost is calculated as:
   The process of linear mathematical expectation of borrowed  funds cost is calculated as: [Alexander Shemetev] (94)
  Where:
  A% - is 12.75% (let"s take this rate), ie, the maximum rate of payment of interest for inclusion on the costs that reduce taxable income, which are reflected in line 070;
  K - is the amount of funds specified in line 070;
  P% - is a market average rate on loans for a company. It is equal to:
   P% – is a market average rate on loans for a company. It is equal to:  [Alexander Shemetev] (95)
  Where:
  λ1 - means the average market rate for long-term loans;
  λ2 - means the average market rate for short-term loans;
  510, 520, 610, 660 - these are the balance line numbers.
  This P% value allows us to calculate market average expected cost of borrowings without implicit interest for an individual company. These calculations are useful for calculating the correction and WACC(TL) values for third-party company.
  It is also possible to construct a linear expectation value of , which is equal to:
   It is also possible to construct a linear expectation value of  , which is  equal to:  [Alexander Shemetev] (96)
  Construction of linear expectation is necessary, because it is not allowed in the domestic account to reflect the interest payable in their full volume. At the same time, they are of the most important indicators of financial stability of an individual firm.
  If the 070 + betta [Alexander Shemetev] value is less than the value of 070 line / profit and loss statement form number 2 on OKUD /, which is extremely unlikely, in this case, you should take into account the value of just 070 line.
  Now you yourself have seen that this method provides a good alternative in the calculation of the most hidden part of WACC valuation of business-systems at the market - this is the debt capital for both open and hidden interests.
  And now, look again, please, in the above table of the 15 coefficients that reflect internal hidden processes from the first stage of bankruptcy. To find out whether your company or a third-party company is under the hidden signs of failure, - there can be done, first, an analysis of the above figures, particularly, the ones related to blitz-value of company, profitability and WACC. Secondly, you should also calculate the formula for signs of latent stage of bankruptcy (LBS), which is developed by the author of this paper (97):
   Secondly, you  should also calculate the formula for signs of latent stage of bankruptcy (LBS),  which is developed by the author of this paper (97):  [Alexander Shemetev]
  Where: a1, a2, ..., a15 - are the derived from the corresponding numbers of financial ratios in the table above, in this case, each coefficient can take only two values: 0 and 1. If the rate is normal, for example, if the profitability-return ratio is higher than WACC (under the corresponding indicator), then put 0; if it is not so - the LSB indicates the negative state of the component, then put 1. If the value of the formula will be higher than 0.6 - it will certify that there are some essential features of the latent stage of bankruptcy!
  Latent stage of bankruptcy (unless not to change the marketing and / or investment cycle) usually goes to the stage of financial instability. This is an intermediate stage between the open bankruptcy and hidden bankruptcy.
  Sometimes, if a business owner can"t calculate this stage in-time, and the owner begins to believe that the crises are provisional, that the situation will improve itself in the future, and a company needs only to stay on a surface for a some time. Also, there will be the similar situation, if the business-owner considers that everything is OK in a company. In both these cases this situation can prolong itself.
  The basis of the expense by which the company can operate in the market at this stage of bankruptcy - is to attract additional portions of debt capital to cover the shortage of liquidity. At the same time, they are often limited to an analysis of what the production process is continuing ... by reducing the analysis to a part of non-current assets which the author of this paper calls "passive assets", which are for some reason some people in such situations considers as assets which increase the company"s financial stability. These are such "passive assets" as: buildings of fixed assets" objects, unfinished construction, grain stocks, stocks of some securities (LTFI, as you, my dear reader, remember, are the non-current assets according to Russian accounting), and so on. Well, in such situations some people believe that these "passive assets" will be sufficient to cover company"s liabilities in case of internal and/or external crisis.
  Actually, in Russia it happens so. The author of this paper provided the research. The result of the research is that the during the bankruptcy procedures in Russia, about 69% of all means returned from selling assets of debtors during bankruptcy procedures are returned due to the fixed assets" realization. And circa from 2,7% to 6% of all the total sum of claims of creditors in different regions of Russia are to be returned to the creditors of all queues, in 2011 and the beginning of 2012.
  So, laying all the hopes to the "passive assets" - it is not the best strategy to overcome the internal and/or external crisis. Besides, such strategies, usually, lead to the open bankruptcy procedures.
  In this situation they often assume that companies need only a little hold on the market and "crank" after external or internal crisis just a couple of turnovers of capital - and then everything will return to normal. About such-like-argument, with some proofs, depending on the specific situation, there gave such "attentive" business-owners as Jacques Boyrel, William Stern, ... .., .... The "non-attentive" people, in disparity to the "attentive" ones, - they don"t pay attention to the state of affairs in their business, like, for instance, Adnan Khashoggi and others did this.
  This stage, the financial instability, - is the most dangerous thing for business. There is a theory of catastrophism, whose prominent theorist is Adizes (Adizes, 1998). This theory says that the most difficult and dangerous to a business - it is becoming a business. For business, it may be true, and not for its owners - the most dangerous thing for them - is to overlook the trend of the company developement to the stage of financial instability, as well as to overlook the very beginning stages of financial instability.
  That is why at this stage the business owners are sorted by: those who can rebuilt all everything to be more stable; those, who will liquidate their business and retire in the "best faith" possible; and those, who will become real "minus millionaires", who can and after the liquidation of their business remain liable for their debts to third parties...
  Thus, the stage of financial instability - how to reveal it? Firstly, it is necessary to analyze the characteristics of the latent stage of bankruptcy. Coefficient (97) is again below:
   Secondly, you  should also calculate the formula for signs of latent stage of bankruptcy (LBS),  which is developed by the author of this paper (97):  [Alexander Shemetev]
  If this ratio shows a value less than an half, that is, an half of the normal business processes are significantly compromised - this indicates that the company is very likely not to have satisfactory financial strength, and it is in the process of financial instability.
  At this stage, yet the company continues to pay the debts and may receive a substantial net profit. The data analysis is disappointing - the company reduces its share of the market presence, product demand starts to fall, resulting that the company has "overstock" of its products, raw materials, storage of which is itself worth the money.
  To improve the situation in this area, the company starts to sell its products in all ways, primarily, by increasing receivables. To cover the liquidity constraints in the manufacturing process (for new materials, on wages, on payment of interest on other loans, ....) company begins to borrow increasingly. That's because of developing stage of financial instability. The pessimistic version of the company"s development at this stage - is the transition to the stage of clear of bankruptcy.
  So, what are the indicators, in addition to the above parameters, which are under latent bankruptcy, saying that the company is in the process of financial instability? The indicators are:
   So, what are the indicators, in addition to the above parameters, which are  under latent bankruptcy, saying that the company is in the process of financial  instability? The indicators are: [Alexander Shemetev] (98)
  This is an indirect reference index, which shows how effectively money is spent to cover the cost of capital, that is "the price of work" in the market during the reporting period, for example, over the year. The higher it is (WACC*TBS) - the worse. It is especially a situation of no good, when this ratio is above the total revenue sum.
  The minimal capital depreciation rate may be, for instance, equal to an inflation rate; or to the index of prices for certain groups of goods primary or indirectly associated with the business, and so on. This data can be easily found in the mass communication media, primary, at the official governmental bodies cites and issued by them journals.
  The other negative trend is next:
   The other negative trend is next: [Alexander Shemetev] (99)
  If the WACC (OC(Eq)) is greater than the net profit (required prior to distribution, especially for JSC companies), this indicates that the rate of return for investors can not to be paid-off in a full volume by means of internal cash-generating mechanism that is created within a certain company. That means that the internal rate of return for a company is lower than it was forecasted by the investors during the business-planning stage.
  The presence of this negative trend is especially harmful to subsidiary companies (the share of ownership is greater than 50%) and affiliated companies (the share ownership is above 20% for the right to participate in management, and it is less than 50%), as well as for joint-stock-companies (JSC), because it may lead to a massive outflow of investment from business, which may take the company off the market, further dropping the performance of its activities.
   The  presence  of  this  negative  trend  is  especially  harmful  to  subsidiary  companies (the share of ownership is greater than 50%) and affiliated companies  (the share ownership is above 20% for the right to participate in management, and  it is less than 50%), as well as for joint-stock-companies (JSC), because it may lead  to a massive outflow of investment from business, which may take the company  off the market, further dropping the performance of its activities. [Alexander Shemetev] (100)
  The left side of the formula shows the theoretical amount of occurring-every-period-payments deductions in the cost of capital coverage to creditors. The right side shows how much money during this period company actually earns in a "clean" form, recalculated to sum before to pay the cost of borrowed capital.
  If the left side is more than right one - it speaks about the crisis in the company and that the company has worked this period for its creditors.
  It also shows the theoretical amount of shortfall, which the company will have to cover for a certain period from other sources.
  Value % / 070 / + β can be calculated by the formula (96).
  This relation says that the company does not satisfy its creditors, which is much worse, as if only company"s owners and investors were not satisfied. Obligations to creditors are always firmly fixed -the company will have to pay them in any case: whether it has income or not.
  If the income is not enough, the company will have somewhere else to intercept resources: to borrow either from other lenders or investors, for example, by issuing more securities (and investors" sentiments about expected returns are subject to change if the firm fails to continue its normal functioning)! By the way, % / 070 / - is the sum of interest expense, which, in particular, is reflected in the code line 070 in the profit and loss statement.
  Credit leverage / ACLF /, in my opinion, can be attributed to indicators for signs of financial instability with respect to the Russian reality. The formula for calculating is the following:
   Credit leverage / ACLF /, in my opinion, can be attributed to indicators for signs  of  financial  instability  with  respect  to  the  Russian  reality.  The  formula  for  calculating is the following: [Alexander Shemetev] (101)
  If the inequality is satisfied, then it says that the company pays for the borrowed funds less than it earns. The sum of the trend will show how much debt capital the company can attract to remain at breakeven. Thus, if the index was found to be 1.25 - it says that the company may attract an additional 25% of the available amount of debt on an equal footing, and if 0.86 - it says that the company needs to get rid of about 14% of the amount of borrowed capital to reach the break-even.
  It should be noted that the ACLF very much varies depending on the again-taken-loans. This change in the Russian context is much more than simply the ratio of new loans made, for example, to loan capital and to other indicators. % Change in credit in comparison with (101) is the power of leverage. In Russia, the levers are very strong because interest rates on loans are so high that virtually no company can earn for themselves a return to sufficiently cover the normal market credit products rates. The negative effect of leverage makes so, that companies must cover loans by their own turnover.
  Force lever - is a comparative qualitative indicator of the stability of the companies at the market. You can compare the leverage effect for your company with the other competitors to find out whose company is generally more stable in the market for credit obligations to fulfill.
  This indicator (ACLF) must be greater than 1, which shows that the company retains its "natural" ability to pay in the market, and it does not need to resort to "artificial" means, for example, new loans or the sale of assets. The approximate equality 1 - is as a negative indicator. If the ACLF is less than 1, it indicates that the company is working to satisfy its creditors only. The period of work for the creditors of the year (TERM(ACLF)) for any company is:
   The  period  of  work  for  the  creditors of the year (TERM(ACLF)) for any company is: [Alexander Shemetev] (102)
  And here are only part of the creditors, which may accrue hidden interests and other interests. However, this figure does not account for the very payable, if the interest on it is not calculated. To determine who is a company works for - it can be done only when all other income and expenses are included into borrowed funds.
  There is a theory of firm"s profitability, which states that the bulk of the company"s means are taken from working of company"s production processes (expressed in the presence of stocks and finished products and (Inv)) and through sales of products under the terms of accounts receivables (AR). The author of this paper believes, that for these indicators there is a need to add short-term financial investments (STFI) (line 250) as an additional source of income. Then let us, for simplicity, take the sum of short-term liabilities: Accounts payable (AP). Thus, we have a firm that produces something and has commitments payable. All these indicators are of operational (production) cycle of company. Then, the period during which the principal operating cycle is directed to work in accounts payable (TERM(OC/AP)) is calculating according to formula, developed by Alexander Shemetev, who is the author of this paper:
   Then, the period  during which the principal operating cycle is directed to work in accounts payable  (TERM(OC/AP))  is  calculating  according  to  formula,  developed  by  Alexander  Shemetev, who is the author of this paper:  [Alexander Shemetev] (103)
  
  If the timing for (102) and (103) is more than 300 days, when it is expressed in the formula, developed by the author of this paper:
   If the timing for (102) and (103) is more than 300 days, when it is expressed in  the formula, developed by the author of this paper:  [Alexander Shemetev] (104)
  If this relation is not satisfied, then it can be suggested that financial instability, in general, can be found in the production cycle. Indicator (104) shows the expected amount of time that the company is working on its creditors during the year.
  If the company is working on its creditors more than 300 or even 365 days a year - this means that, whatever happened to this company, the owners or the entire company as a whole, do not receive adequate rate of return or receive no return at all.
  If this rate is of more than 300 or 365 days, it shows that the company either is in a deep stage of financial instability, or is in the development of latent stages of bankruptcy, and it keeps itself at the expense of its turnover.
  However, in addition, it is necessary to calculate and financial cycle, which can be viewed on the coverage ratio formula CRF:
   However, in addition, it is necessary to calculate and financial cycle, which can  be viewed on the coverage ratio formula CRF: [Alexander Shemetev] (105)
  If this value is greater than 1, it indicates that companies have enough revenue to cover the resulting short-term debt related to their activity that generates revenue, therefore, the financial cycle operates well.
  If this inequality is not satisfied, then it suggests that bankruptcy may soon move into a definite form, and the situation requires emergency measures, because it shows that to maintain the normal cycle of the company there soon will be the need to get the value of borrowed funds, greater than (it is calculated according to formula, developed by the author of this paper):
   If this inequality is not satisfied, then it suggests that bankruptcy may soon  move  into  a  definite  form,  and  the  situation  requires  emergency  measures,  because it shows that to maintain the normal cycle of the company there soon will  be the need to get the value of borrowed funds, greater than (it is calculated  according to formula, developed by the author of this paper):  [Alexander Shemetev] (106)
  Dear reader, please, note: the deficiency > 0 - this is an excess; the deficiency < 0 - this is deficit.
  This is a part of the money that companies have to obtain for additional liquidity to cover the losses of short-term obligations: that they will have to get either through new credit, or by stimulating the marketing cycle. In any case, if the deficiency is negative - then it indicates the presence of a firm's financial instability.
  And the last important parameter is the net profit (NP), which should be clearly greater than 0:
   And the last important parameter is the net profit (NP), which should be clearly  greater than 0:  [Alexander Shemetev] (107)
  Thus, the stage of financial instability - how to reveal it? There must be evaluated complex coefficient, developed by Alexander Shemetev (108):
   Thus,  the  stage  of  financial  instability  –  how  to  reveal  it?  There  must  be  evaluated complex coefficient, developed by Alexander Shemetev (108): [Alexander Shemetev]
  Where: a1, a2, ..., a15 - are the derived from the corresponding numbers of financial ratios in the table above, in this case, each coefficient can take only two values: 0 and 1.
  a(98), a(99), a(100), ... , a(107) - are the numbers of ratios that correspond with the formulas in the text above; for instance, a(107) - is the formula number (107) in the text above. Each coefficient can take only two values: 0 and 1.
  If the rate is normal, for example, if the profitability-return ratio is higher than WACC (under the corresponding indicator), then put 0; if it is not so - the LSB indicates the negative state of the component, then put 1.
  Dear reader, please, note: negative means not mathematically negative - it means a negative logical value of the specified financial ratios.
  If the specified rate (108) is less than 2 / 3, it testifies that there were signs of financial instability inside a company, and if the figure was less than 0.5 - it says that the company is under full financial instability.
  If this figure was less than 1 / 3, it testifies that there were clear signs of a company to become a company under bankruptcy in the future.
   So, the last and lowest degree of financial stability - is the stage of explicit (public) bankruptcy. Thus, the apparent failure consists of three stages: the economic, financial and legal. Sufficient basis for the diagnosis of economic bankruptcy may be the value of the coefficient (108) less than 1 / 3.
  If this indicator to be added by the facts of nonpayment of liabilities, it says that there were clear signs of a company's financial bankruptcy, when the financial cycle ceases to function properly. And if the company has begun on one of the five bankruptcy proceedings in court: surveillance, financial recovery, external control, bankruptcy proceedings, the settlement agreement - it says that the company is in the final, fifth stage of bankruptcy and has a miserable financial stability, that is, this indicates a loss of financial stability and interception of company"s property.
  Contained herein the Alexander Shemetev"s model of determining the degree of financial stability can not just diagnose the condition of the company, and also to see the weaknesses in its work, which should help facilitate the production of anti-crisis solutions. The anti-recessionary policy of the company should be directed at suppressing the destabilizing component that is shown by negative indicators" trend.
  3) Model of the definition of company"s financial stability
  This model was developed and tested in practice by leading Russian national experts in the field of economics and finance: A. Grebenkin, V. Akberdina, R. Akberdina, A. Anikeeva (Ural State University after A.M. Gorky research). This technique focuses on a quick analysis of financial stability of companies.
  At the first stage, there is estimated the rate of permanent presence of working capital (PPWC) by the formula:
   At the first stage, there is estimated the rate of permanent presence of working  capital (PPWC) by the formula:  [Ural State University after A.M. Gorky research] (109)
  Where: PPWC - these are owned mobile assets; OC(Eq) - it is equity capital; LTL - long-term liabilities sum; ImmA - Immobile assets.
  In the second stage, there are calculated normal sources of supplies (NSS):
   In the second stage, there are calculated normal sources of supplies (NSS):  [Ural State University after A.M. Gorky research] (110)
  Where: BLtoInv - these are the bank loans used to cover inventory and costs related to them; LtoInv - these are other loans that are used to cover inventory and costs related to them; APtoTT - it's accounts payable to trade transactions.
  These data are sufficient for these experts to identify and evaluate the type of financial stability in the market:
  Absolute financial stability appears if:
   Absolute financial stability appears if: [Ural State University after A.M. Gorky research] (111)
  Where: Inv - these are inventories.
  Normal financial stability appears if:
   Normal financial stability appears if: [Ural State University after A.M. Gorky research] (112)
  Also here impose the condition that the PPWC itself to be greater than 0! Otherwise, the company has a precarious financial situation.
  Precarious financial situation appears if:
   Precarious financial situation appears if: [Ural State University after A.M. Gorky research] (113)
  The critical financial situation appears if:
   Precarious financial situation appears if: [Ural State University after A.M. Gorky research] (113)
  In addition to this inequality: the company has overdue debt and overdue payables and receivables. If such a situation, where the third inequality holds, will be chronically repeated, it must inevitably lead to bankruptcy of such entity.
  There should be performed some additional checks for the company to identify its financial stability. Diagnosis and trend of the company are achieved through coefficiental indicators inter-relationships recommended values.
  The author of this paper created a table specially for you, dear reader, so you could easily understand this method. The table contains the ratios, their calculations and recommended values, as well as the short descriptions of these financial ratios:
  The author of this paper created a table specially for you, dear reader, so you  could  easily  understand  this  method.  The  table  contains  the  ratios,  their  calculations and recommended values, as well as the short descriptions of these  financial ratios:  [Alexander Shemetev]
  The author of this paper created a table specially for you, dear reader, so you  could  easily  understand  this  method.  The  table  contains  the  ratios,  their  calculations and recommended values, as well as the short descriptions of these  financial ratios:  [Alexander Shemetev]
  Also of note is how one calculates the amount of net working capital (NWC), which is used in the formula (121):
   Also of note is how one calculates the amount of net working capital (NWC),  which is used in the formula [Alexander Shemetev] (121)
  Where: NWC - this is the net working capital; MobA - These are current assets; STL - These are short-term borrowings.
  The above-described technique, referred to earlier authors, allows one to quickly and effectively determine the degree of financial stability of a single company in the market.
  In addition to the above techniques - there is another method - the method of matrix analysis of financial stability, which we are now consider here.
  
  4) The method of matrix analysis of financial stability
  
  In the old times, the Soviet Union"s accounting was somewhat different than Russian"s today. Today it is almost completely died: the memorialniy-order accounting method and chess-forms of accounting. But the concept of chess forms of accounting has grown today into something more in Russia, into matrix analysis, which again is to make up all of the same form of chess accounting, which is a very convenient tool for further analysis of financial stability. Prominent domestic theorists of matrix analysis of financial stability are V. Artiushin, M. Litvin, I.T. Balabanov, A. Grachev, A. Anikeeva and others. They discussed the main issues of formulation, implementation and analysis of matrix balances.
  When compiling the balance matrix evaluation system, balance is the basis of the asset, which consists of current assets and non-current assets. Asset is financed by passives: equity and debt (short and long term) funds. The beyond technique makes the assumption: repayment of current needs in the lines of the asset goes rationally from passive in such a way that long-term liabilities cover (finance) long-term assets; short-term liabilities cover (finance) short-term assets; and equity can cover both of these types of assets. In this method the balance lines are compiled enlarge - this is the basic rule of the matrix method.
  The matrix analysis is considered very difficult - there are many books written on how to perform it. The author of this paper, Alexander Shemetev, cumulated all this material into a short, friendly and easy-to-understand scheme:
  Scheme: Preparation of consolidated elements of the matrix (chess) balance analysis
   Scheme: Preparation of consolidated elements of the matrix (chess) balance  analysis  [Alexander Shemetev]
  As it can be seen from the scheme , the formation of chess (matrix) balance goes in accordance with the following scheme: first, are the resources of I turn, then II, then III and, finally, IV.
  Thus, there is the allocation of funds along the lines of balance. It turns out a chess table, the rows of which are consolidated assets, and columns - are liabilities.
  It worth noting, that sometimes it occurs also the construction of the matrix on the contrary - in rows - there are liabilities, and the columns contain - assets - for some people it is more comfortable - the essence of the analysis and the essence of this matrix are unchanged in both variants. Next, one should construct the matrix itself. Rather, one should construct four matrices:
  1) According to the beginning of the reporting period.
  2) At the end of the reporting period.
  3) According to the data: the difference between the beginning of the reporting period and the end of the reporting period.
  4) According to the receipts and expenditures of the company.
  It should be noted that the author of this paper created the above schema about the theory of matrix analysis for clarity and for you, dear reader, could better understand and remember the material. Let us construct the matrix for the as an example for clarity of the material:
  Table: Data from Company "Good Luck" on 01.01.2011, million USD
  Table: Data from Company
  
  So, let's define the level of financial stability of conventional company "Good Luck" with a method of matrix analysis. The author of this paper proposes to do this with the columns "residue" (it shows how much money is left to consider in a row) and the "sum" (it shows how much it has already been accounted in this line).
  
  And let's refer the default funds that are not amenable to the above scheme (when the chain of four elements of the scheme has already been exhausted) - let"s refer such funds as the anomalous distribution of funds (in the table are in italics and underlined bold) - these are the tools that impose certain conditions to maintain financial stability, and they should be considered first when planning and implementing anti-crisis strategies.
  
  Table: Chess-balance matrix of Company "Good Luck" at the beginning of the reporting period, millions USD
  Table: Chess-balance matrix of Company
  
  Zeros in the matrix mark the lines that have no funds left for their repayment due to their spending on other needs of company.
  It can be seen from the chess balance, that the entire authorized capital goes to finance intangible assets, fixed assets and, in a very low degree, to finance the capital investments, ie, the fixed assets.
  The anomalies in the allocation of resources for the company are due to the fact that the postponement of payments on accounts receivable and short-term financial investments is financed by retained earnings, which leaves a significant imprint on the company's activities: there is the need of some cash reserves to avoid bringing expensive in Russia loan resources. And, conversely, for foreign companies it may be better to use cheaper debt capital rather than the more expensive owned one. It all depends on where are situated the structural units of "Good Luck" Company.
  Let's continue with the matrix analysis of the financial sustainability of the company. The 2011 is passed and we know the data for 2012:
  Table: Data of Company "Good Luck" on 01.01.2012, millions of USD
  Table: Data of Company
  
  Thus, the company"s book value grew by 2% for the year - this is a good trend. Now let's see how things have changed financial stability.
  Table: Chess-balance-matrix of Company "Good Luck" at end of period, millions of USD
  Table: Chess-balance-matrix of Company
  
  In the balance, to avoid double counting, there deleted the AP sum, realizing that it has already been included in STL. Thus, the financial stability anomaly changed its emphasis: the lack of liquidity of receivables and STFI is largely covered by LTL. Overall, the company is financially stable.
  It is usually compiled the analytical matrix of changes in the balance during the reporting period after creating the chess-balance-matrix (at the beginning and end of the reporting period). For Company "Good Luck" it is as follows:
  Table: Analytic matrix chess-balance of Company "Good Luck"at end of period, millions of USD
  Table: Analytic matrix chess-balance of Company
  
  The data from analysis table shows that the structure of assets" financing has undergone through significant change over the reporting period. The fall during the reporting period is marked and underlined double.
  First, the STL and AP are decreased themselves - the financing switches itself to long-term funding sources. It is a positive trend in the presence of cheap debt. However, in Russia the borrowed capital is expensive, besides, the LTL carry the hidden interests that makes it even more expensive - this may increase the risks for company in period more than '01, when those hidden percent will mostly start to arise. It requires additional analysis of how it will change the value of WACC for the company.
  The RE now covers less STFI and MF, due to the fact that the MF itself and STFI decreased in their volume which, of course, is about twice lower quick ratio. That is, the company needs an instant insurance reserve, for example, a credit line or a subordinated partner who could provide a subordinated loan in case of instant commitments arising.
  AC started to finance LTFI instead of CapI and FA, , which is due, most likely, to the depreciation-deterioration of FA. Thus, company should view the policy of renovation of worn-out capital over the medium to long term perspective.
  How do you, dear reader, have guessed, the above formula cells were calculated as follows at the above matrix:
   How do you, dear reader, have guessed, the above formula cells were calculated  as follows at the above matrix:  [Alexander Shemetev] (122)
  That is, the total cell (CELL) is equal to the same cell at the end of the reporting period (CELLend) minus the same cell at the beginning of the period (CELLbeginning). Sometimes this kind of balance is called the dynamic matrix balance, meaning that it shows the change in balance sheet items in the dynamics.
  The fourth type of matrix - the balance matrix of incomes and expenditures of funds no longer wears the form of chess in shape - it is just a list. For its basis there was taken the old Soviet accounting for gains and losses. Therefore, logical is to take just a modern statement of profit and loss account and watch the dynamics. Right now we did not consider the analysis of profit and loss statement - it is done below in the text.
  The Soviet method of filling a "matrix of balance"
  In the Soviet Union since the 1930s there was a special form of financial statements - chess-balance - it is considered above. And here's the order of its filling - it is slightly different from how it was done in the USSR. In the USSR, chess has always started to fill in the form from non-current assets (ImmA), as we have done, and then gradually changed to current assets (MobA). The only difference in the sequence is in write-off the passives.
  If it is painted the whole scheme of passive distribution for each section, then everything was simpler: - first the equity was distributed (AC, then OC, then retained earnings), second the long-term liabilities were distributed, third - the average-term (nor they are referred to long-term ones), and, at last, the short-term liabilities, starting from accounts payable.
  As a result, the assets and passives converged - and they get a chess balance. You, dear reader, you can also use the balance of chess is not only the above-described scheme, and also in the manner described above in the old Soviet pattern.
  Chess balance was mainly used for industrial and some other enterprises (there were no commercial entities, so the word enterprise has been synonymous with "establishment" - "state property"). State unitary enterprises, especially, industrial, and their directors and heads of departments were required to account for the result of their activities and the implementation of the plan, and an important part of the report was an explanation of how the enterprise funds were spent. A chess balance helped much in it then.
  Chess balances then boiled down into single multi-sectoral balances, analogues of the Leontief matrixes, which were then calculated and used for planning and functional forecasting for entire sectors of the economy in a stable static non-market economy.
  Today there is a lot of criticism of the matrix (chess) systems for the analysis of financial stability. Among the highlights are the following criticisms. Firstly, the technique is very resource-intensive. Secondly, you need to maintain accounting parallel, preferably, from the founding of the enterprise. Third, the consolidation of indicators and models of resource allocation between asset and passive is rather subjective, since the objective reflect of the relationship of modern accounting entries by chess accounting is difficult. And also, the criticism itself subjected to mathematical techniques used in chess matrices: from an analytical matrix to the matrices analyses themselves.
  Despite criticism, the matrix analysis model of financial stability is a tool for planning and activities analysis in the market for managerial staff, and one can"t use only this model.
  Well, we got an acquaintance with four theories of determining the degree of financial stability in the market. Now let's look together at coefficiental concept of determining the degree of financial stability in the market.
  
  5) Coefficiental concept of financial stability definition in the market
  Coefficiental concept is unlike to all other approaches by the fact it identifies the internal trends that dominate inside a certain firm, instead of determining the stage and degree of financial stability.
  Coefficiental approach, as it is easy to understand from the name, involves the calculation of balance and off-balance coefficients. Coefficiental approach to the definition of financial stability involves a number of key indicators of financial stability and a number of additional ones.
  In this case, three key indicators to determine the financial stability overlap between each-other, though they have a different name. These are level of debt ratios, therefore, they show also the equity share. These three ratios show respectively three risks for this indicator for the financial, operational and investment cycles (it is used in more comprehensive analysis).
  For Russia, this ratio is very relevant, because the cost of debt capital for non-financial sector is very high. So high that usually it over-covers companies" profitability, therefore, the financial leverage action is negative.
  For convenience, the author of this paper brought all the financial ratios into simple to use matrixes. It is done so here, as well as in my very first and very second books, published in 2009 and 2010.
  So, let's get together with you proceed to consider the matrix system of the most important indicators of financial stability.
  
  So, let's get together with you proceed to consider the matrix system of the  most important indicators of financial stability.  [Alexander Shemetev]
  
  
  So, let's get together with you proceed to consider the matrix system of the  most important indicators of financial stability.  [Alexander Shemetev]


  Now I will write the denotations of the ratios :
  1) F1 - shows the availability of the company's own working capital, attracted without the use of borrowed capital. These are the funds that are fully financed by the company itself and for which the company can always count on in the manufacture of its products. The higher is the ratio - the better it is for company. Ideally it should be above 0.2.
  Intuitively: Factor indicates how many cents in maximum of company"s own funds can logically be accounted for 1 dollar of all its current assets. If the coefficient is negative - it means that part of current assets is financed with a loan sources. This may be normal, if borrowing is cheaper than the own-capital, and, in this case, there is a danger of the bifurcation explosion of the environment consequences. In Russia, return on assets and equity value in most cases is lower than the price of debt capital. Exceptions are part of the banking companies and para-banking systems and some agricultural companies, mainly, poultry farms, that have access to cheap credit resources, for instance, for agriculture (cereals-producing and other highly-profitable-in-certain-periods-companies are denied of such a possibility, due to the fact that the discount on debt capital is in offset by the high risk and complexity of access to cheap credit sources).
  2) F2 - shows how much of working capital is necessary to cover an important part of current assets - inventory. The higher is the ratio - the (usually) better it is for a company. And if the owned-working-capital is not enough to cover the entire value of stocks, we can calculate the need for additional borrowing to maintain company"s production. Do not forget to emphasize that in stocks line they have already finished products!
  Intuitively: Factor indicates how many cents in the maximum equity funding goes to one dollar of cost of finished goods and other inventories, the basis of the production cycle of a company.
  3) F3 - displays mobility ("turnover") of financial resources of the enterprise. Why is mobility? The fact that this factor, which came to us from the American practice of financial analysis and have taken root here, shows how much of their own working capital can be accounted as a percentage of equity. Mobility Assets - in English - it's mobile assets, called us by tradition current assets. Therefore, this factor is called the coefficient of mobility of the enterprise. The higher it is, the higher the mobility of company"s own business-systems-processes - the better it is in total! Do not forget the relationship between enterprises in different sectors of the balance - what we have already discussed in this paper in the section on express-analysis of financial condition of company. Thus, the enterprise may have this rate relatively low, and trade companies - may have it higher! Working capital which is financed from companies" own sources of financing should not be below 50% in Russia, that is, the ratio should exceed the rate of 0.5!
  Intuitively: Factor indicates how many cents in maximum of company"s own mobile (wrapped in a year) capital is accounted for 1 dollar of equity.
  4) F4 - shows the share of manufacturing-related-assets in the equity of an enterprise. The high value of this coefficient - is in the norm for the industrial and contiguous to them companies, and it's a bad trend for shopping and close to them companies (in the business-sphere of activities of those enterprises). It is preferred the positive trend of this index.
  Intuitively: Coefficient indicates how many cents on each dollar of equity capital are to finance fixed assets.
  5) F5 - shows the share of long-term debt to permanent capital. The company has a Permanent capital, consisting of its own sources and long-term credit. In fact, this ratio shows what proportion of permanent capital will ultimately have to be paid to creditors....
  Intuitively: Coefficient indicates how much of a long-term debt, which usually lurk hidden interest, is accounted for 1 dollar of permanent (stable) capital.
  6) F6 - shows the share of manufacturing-related-assets in total value of company"s property. This factor shows the funds that are directly involved in the production for a certain date or on average. This is an important element in the planning of the enterprise activity, especially when planning the current financial needs.
  Intuitively: Coefficient indicates how many cents of the book value of production-related-assets are accounted for each dollar of book value of the company itself.
  7) F7 - shows what percentage of the total value of the company is in company"s own funds. It is clear that the rest part - it means credit. The lower the coefficient is, the higher the cumulative risk for the business-venture!
  Intuitively: Coefficient indicates how many cents on equity has each entire dollar of company"s book value.
  8) F8 - shows the share of borrowed funds in the equity of the company. Sometimes it also happens that the leverage ratio is 250% of company"s own funds, that is, and it can be 0. Speak authentically about how good or bad it is - it can only be made through a detailed study of company from the inside. For example, there are some companies with 0% loans, which go from the market due to their unprofitability. And there are some companies that share of the equity is about one tenth of the total shares in the company. And these companies are successful, giving a high return on the equity in the total-average of about 20 - 30 per cent per annum! For example, a common Russian commercial bank is a type of such a company: they would gain even more borrowings, if not the requirements of the law .... On why banks are making super profits, when they themselves do nothing but they take loans (deposits - are some like loans for clients), and they give loans - we'll talk about this later. One thing is for sure - the higher is the percentage (interest) of loans that should be extinguished from company"s own resources - the higher is the risk for a company! Companies with high shares of expensive debt capital need an effective risk-management!
  Intuitively: Coefficient indicates how many times the borrowed funds are available relative to similar cost of equity capital, or how many times debt is greater than company"s own funds. Coefficient allows us to see what element of debt (long-term or short term) has the largest weight in borrowed capital. This is a risk factor of operating cycle, because it has no norms - it should be looked at the dynamics.
  9) F9 - shows the share of borrowed funds in the equity of the company, giving the standard for the whole - not more than 2 / 3 (less than 67%). The higher the percentage of borrowed funds is, the higher is the business-activity-risk for a company.
  Intuitively: Coefficient shows how many times the borrowed capital is greater than the owned one. This is the ratio of the financial cycle, ensuring the solvency and creditworthiness of the company; in the Russian context it should not exceed two thirds of equity book value.
  10) F10 - shows the overall financial stability of the company, expressed as a percentage. Actually, it shows how much the company's assets are financed by reliable sources - the permanent capital.
  Intuitively: Factor indicates how many cents on the sustainable capital are accounted for 1 dollar of total capital. If a company is funded by unsustainable sources for more than one third, it is a negative trend and a significant risk for business-activity in the Russian context, where borrowings are expensive.
  11) F11 - shows the "mobility" of company"s capital, or how many dollars and cents of current assets are accounted for each dollar of non-current ones. There is no general rule for everyone about this optimal ratio. Ratio for each firm should be selected individually, depending on company"s business sphere: industrial production or trade. The higher the coefficient is, the greater is the percentage of funds allocated to the financing of current assets.
  Intuitively: Factor indicates how many cents of quickly-to-turnover funds are accounted for 1 dollar of slowly-to-turnover funds (during a reporting period).
  12) F12 - shows the share of assets for production purposes in the assets of the company. The recommended value - it must be greater than 0.5, that is not less than 50% of all assets of the enterprise should be owned production facilities (it is fair for non-trading-companies in the Russian context). If the figure is below it, you may need to attract additional loan funds to replenish the company's assets.
  Intuitively: Factor indicates how many cents of property are directly involved in the production and lengthens the production cycle for each dollar of company"s book value.
  13) F13 - shows the share of loans in the total capital of the company. The higher the coefficient, the lower the overall financial independence of the company and the higher the overall business risk as a consequence, the lower the financial sustainability of the enterprise. In two words, high values of this ratio are harmful for companies in cases when the borrowed capital is expensive enough. At high values of this coefficient - it is necessary to use the highly-thought-out management, in particular, the effect of financial leverage ("leverage ratio"). The higher the value of this coefficient, the more "cautious" should be the enterprise itself. Recommended value: less than 0.65, that is, loans must be at most 65% of the total capital, otherwise it increases the risk of bankruptcy. The higher and more volatile bank rates and market interest rates, the lower should be omitted recommended value of this index!
  Intuitively: Factor indicates how many cents on the borrowed funds go for a dollar of company"s book value. It is a measure of the investment cycle, indicating the possibility of creating a fundamentally new investment to turn for a company; that is why the volume of high risk (expensive) loans should not exceed 65%.
  14) F14 - shows the share of long-term debt to total capital of the company. Financing activities of the company shall be made in the first place due to stable sources of coverage, which primarily include equity and long-term debt. If there is insufficient equity, or "high cost" of it (if you have a place to invest it in a more lucrative way). Assistance should be held primarily at the expense of long-term debt! Recommended setting for this ratio is - no higher than 0.4, ie, long-term borrowings should not ideally exceed 40% of the company"s book value. Long-term borrowed funds should go primarily to cover the basic production assets of the company! The ratio depends solely on them, as well as it depends on bank interest rates and market interest on loans. The greater an enterprise needs to have many fixed productive assets, the greater their deficit must be covered at the expense of long-term debt! It is therefore vitally important standards for determining the need for long-term debt - as well as the standard F15.
  Intuitively: Factor indicates how many cents of long-term debt, which can especially be charged by hidden interest, are accounted for each dollar of company"s book value.
  15) F15 - shows how much of the fixed assets are financed from stable sources. The main production facilities the company can rent or buy as a property. In the case of a lease or rent, you can "roll out" premises; and then the owner of the premises might want to "buy", let us say so, your business "on the cheap" by getting his premises back to him! Of course, it is hard to break a rental contract directly - that is why he or she can do it mostly indirectly by not to renew your contract with owner, or ... by dramatically increase of the rent for the next periods, because everyone wants to have the property of "untwisted" company, when all the "dirty work" is over!
  Good yield may be buying property in the premises. And funds for the purchase may not be enough. Then a good way is to take the credit, the best, long-term for fixed assets to be financed from stable sources - equity and long-term debt! In the case of option with long-term loan, your rate will high F15, in which case the increase is justified.
  Intuitively: Coefficient shows how many cents go to finance the production-oriented-assets (immobile assets) from long-term sources of funds.
  The study of financial ratios gives a lot, at the same time, the true state of affairs in the company can always be judged only by studying the problem from within. By themselves, the critical values of financial ratios speak reliably only on the high risks for such companies, they say with a high probability that the company has big problems in the critical areas identified during the financial analysis. It is always necessary to watch the situation from within!
  There is a sufficiently large number of additional ratios in addition to the basic factors of financial stability. It should be understood that not all the ratios we need for analysis of financial stability. There are about 55 most major lines of balance. So, the minimal total number of financial ratios from these lines will be (λ * 55! /minimum λ, the coefficiental function multiplier, is equal to 2 /) = 2 * 12 696 403 353 658 300 000 000 000 000 000 000 000 000 000 000 000 000 000 000 000 000 000 000 000 = 2 * 1.269 * 10^73.
  And this is the minimal number of financial ratios that can be taken just from the main lines of a balance sheet. This number has more than 70 zeros. It is comparable to the number of atoms in the universe (approximately 2.19 of * 10^97 - our financial figure is only a few times less!). And some time later, when the financial data is updated - all the calculations you will have to start again! The worst of those calculations will be connected to what was wrong in the previous complex analytical system - and there will always be something, because the business-environment changes itself rapidly nowadays. Besides, it is only a balance... There is also profit and loss statement.... And there are very many key indicators that are important to be analyzed....
  So, the total number of main financial ratios that can be "forced away" out from a mere balance sheet is comparable with the maximum estimated number of astrophysics - the number of atoms in the universe! I said comparable - because it is so without an auditing. If we put audit into the maximum numbers of financial ratios and accounts related to them - there will arise a number much more equal to the maximum estimated number of astrophysics - the number of atoms in the universe!
  The mere description of all these ratios and factors would take at least a 10 times more pages of similar to my first and second books on finance (636 A4 format pages each book). If such is encountered, it can be compared to those as if you are reaching this page would read only the cover of this book, not even touching the content (as you, probably, know, this paper is a part of my future book in English with the similar to the previous books volume)!
  Because of this, people in practice use only 10 - 15 most important ratios, as a rule, usually they are from among the previously cited in the matrix above. Then the analysis can be expanded by number of less important ratios, which are significant for this particular entity.
  The largest companies in the world calculate, on average, a maximum of 120,000 coefficients through the use of neural networks. The average number of coefficients, calculated by the world's multinational companies, on average, is at just over 20,000 coefficients for the entire company. Many of the world's multinational companies for management purposes are limited to an average of only 7 - 22 coefficients.
  And, oddly enough, least of all the coefficients are usually calculated by service companies and financial market companies (which are themselves usually the developers of these ratios).
  Companies of the industrial sphere calculate most of all coefficients. At the beginning of the XXI century these companies faced with a formidable competitor
  Most companies calculate the coefficients of the spheres of industry, which at the beginning of the XXI century are faced with a formidable competitor that "battered" from them all potential and actual investors - these are the post-industrial corporations (service sector, information sector, non-industrial innovation and venture capital companies, ...). That is why the rational business organization for companies of industrial sector became the first purpose of their activity. It became so these companies could preserve their access to relatively cheaper and less risky, in case of success of such company, investment capital, including the shareholders equity.
  That is why there is no reason to "dig the financial analysis in depth". One of the Russian big petroleum fuel corporations has about 37,000 ratios related to the adequate calculation of salary to their employees (they also have big systems for each part of financial analysis). Such-like analytical systems become inflexible. For example, imagine that there were key employees who created such system. How can a new employee start to improve this system? How can one get an acquaintance with it? How can an employee create a part of system and be aware of what is about to be done and is done yet by other employees who work at the same system? To improve such-like systems there must be employees who know how this system was created and how it works. That is why financial analysis based on few ratios is usually much more effective than the system based on thousands of ratios in most cases.
  So, let's consider briefly the basic matrix of additional financial ratios, omitting the factors of industry.
  And now, dear reader, let's move on to the assessment of additional factors of financial stability, developed by the Alexander Shemetev in order an analyst to be able to determine precisely the degree of financial stability of a single company in the market. These indicators are:
   And now, dear reader, let's move on to the assessment of additional factors of  financial stability, developed by the Alexander Shemetev in order an analyst to be  able to determine precisely the degree of financial stability of a single company in  the market. These indicators are:  [Alexander Shemetev] (138)
  Where: WACC - is the weighted average cost of this capital. Cstimterm - is a ratio of stimulated term of return on investment, which shows for how many similar analyzed periods company should pay off to offset the costs associated with the use of equity and debt capital. It is desirable that this ratio was greater than the ratio:
   Where: WACC – is the weighted average cost of this capital. Cstimterm – is a ratio  of stimulated term of return on investment, which shows for how many similar  analyzed periods company should pay off to offset the costs associated with the  use of equity and debt capital. It is desirable that this ratio was greater than the  ratio: [Alexander Shemetev] (139)
  Where: Cpayterm - this is a conditional measure of the actual payback period for investment, TBS - is the total result of the balance (total balance sum); NP - it's net profit.
  You should also calculate the coefficients of the actual payback period of investment in optimistic, pessimistic and normal scenarios of events" development.
  Alexander Shemetev for speed calculations developed the following algorithm parameters, which allow you to find the expected timeframe for return on investment in your company which is analyzed in the three scenarios.
  I) In the pessimistic scenario the forecast payback period is equal to (140):
   I) In the pessimistic scenario the forecast payback period is equal to (140): [Alexander Shemetev]
  WACC (TL%) - this is the weighted average cost of capital in % before the calculation of tax leverage, hat is, the average rate on all borrowings, the calculation of which was already given in this paper.
  This formula calls for comment. It includes two indicators: the arm of risk (the upper line of the formula) and the payback period for the normal version of events (the lower line of the formula after the multiply sign). So, let's look at these figures together.
  The index of risk arm has two components:
  1) The business risk of loss due to a lack of solvency and liquidity to pay off debts;
  2) Risk of loss of market value of the business due to lack of effectiveness of the company for the owners.
  Let's start with a review of the business risk of loss of pay due to a lack of liquid assets to pay off borrowings. Alexander Shemetev believes that this value can be estimated using the developed by him ratio of risk leverage:
   Let's start with a review of the business risk of loss of pay due to a lack of liquid  assets to pay off borrowings. Alexander Shemetev believes that this value can be  estimated using the developed by him ratio of risk leverage: [Alexander Shemetev] (141)
  As you, my dear reader, remember, the WACC value is to be taken as %%.
  Symbols in the formula are:
  Crl - is the ratio of risk leverage, which arises from the use of debt by company.
  iRF - is a risk-free interest rate on risk-free investment projects in the market (i risk-free). iRF, for example, corresponds to 100% rate of return on government bonds of the Russian Federation (according to the Russian law), or 98% rate of return on deposits in large banks (according to the interpretation of the accepted in Russia Cook"s risk ratio (the so called H1)), or investments in other profitable assets" groups, characterized as the highest first group risk-free assets, in accordance with the classification of Cook ratio .
  TL - this is borrowed capital;
  TBS - this is the book value of the company.
  Comments to (141): That is, it is an average-during-period (for example, average-during-a-year) cost of the actual use of borrowed resources for the company.
  If the company fails to meet this rate of return, the borrowing capital will likely to expand to cover the missing rate of liquidity and so on until a company goes bankrupt because of not enough market efficiency, or until the cases inside company go much better.
  All this will expand either a payback period to infinity (payback period of a bankrupt-company tends to infinity), or until the cases inside company go much better (this is what such companies usually expect from the future). These events correspond to negative development scenarios in the market, which lengthens the payback period.
  The second component of the arm of risk indicator - this is business risk, which corresponds to the fact that the return on investment on company"s property will actually be lower than they expected. The owners" (shareholders") contributions to a company - are investments inside this company (the balance sheet amount of such investments corresponds with the book value of equity (OC(Eq)), according to equity definition). And this factor of the arm of risk indicator, the business risk, goes from the fact that company can not to bring the enough rate of return on their investments. Such a situation may destabilizes the company's activities, it may cause massive outflow of investment funds from companies, such as in the case of mass panic in the investment market, when shareholders start to sell rapidly the shares of some joint-stock company or companies (JSC).
  For private (limited liability) companies that risk also has not been canceled too, - it can just appear in a different way: for example, owners may decide to bankrupt the company because of its lack of profitability, or they may decide to cover the missing profitability at the expense of other sources of funds, such as debt capital, or they may do so by restructuring their company into a JSC. Restructuring into a JSC may give access to the kind of investment resources, which may also result in a negative for such company.
  In any case, such company expected to receive some rate of return, and in fact it may get a lower rate of return than expected. The total value of this risk can be expressed in a formula developed by Alexander Shemetev:
   In any case, such company expected to receive some rate of return, and in fact it  may get a lower rate of return than expected. The total value of this risk can be  expressed in a formula developed by Alexander Shemetev:  [Alexander Shemetev] (142)
  As you, my dear reader, remember, the WACC value is to be taken as %%.
  Formulas (142) and (141) are included in the formula (140) as an arm of risk at pessimistic scenario, which can lengthen the payback period for the specified amount. Dear reader, please note that by the word "pessimistic scenario" I mean precisely such a scenario, rather than, for example, the catastrophic variant which is the same for all companies - bankruptcy, if nothing is done.
  Under the "pessimistic scenario", the author of this paper believes that the management staff of the analyzed companies will behave themselves like homo financius ("financial people", Lat. humor.), Ie, in the most efficient way - not to incur additional risks unless it is absolutely necessary; and it is expected from them the most efficient use of limited resources available to meet the actually in-demand-demands of society. Market - is a powerful remediation ("cleansing") tool, which is itself, by default, sanitizes (removes) all the irrational ways of use of companies" resources and all the irrational ways of providing the operations-under-risk (although sometimes it also happens so that companies are just not lucky enough - and this is another story...)....
  II) Let"s go back to our development scenarios in the market and their evaluation. The second component of the pessimistic-scenario-of-events-formula we are considering - is the a normal scenario of events" development, payback period for which is (Cterm(norm)): NORM
   II)  Let’s  go  back  to  our  development  scenarios  in  the  market  and  their  evaluation. The second component of the pessimistic-scenario-of-events-formula  we are considering – is the a normal scenario of events’ development, payback  period for which is (Cterm(norm)): NORM  [Alexander Shemetev] (143)
  The author of this paper has transformed the sum of OC(Eq) and TL into the TBS. Now it clearly seen that the itself and the extent to which the rate is raised (1 + WACC(OC(Eq)) - are very similar. It is no coincidence, because the rate (1 + WACC(OC(Eq)) is being raised in the degree of expected life of a full return on investment, which simply looks like a TBS / NP, which we have considered in the formula (139). This formula is adjusted for the risk component.
  Thus, the rate of (1 + WACC (OC(Eq)) is elevated to some degree n, which reflects the normal payback period of investment:
   Thus, the rate of (1 + WACC (OC(Eq)) is elevated to some degree n, which  reflects the normal payback period of investment:  [Alexander Shemetev] (144)
  In the formula, the author of this paper deliberately removed the simple relation: TBS / NP. Under Russian accounting, the payment of the cost of borrowed funds may not be placed in the base to reduce the taxable income. The said extra-sum is deducted then from the net profit of the company. Thus, the formula (144) describes the payment of interest more accurately than the formula (139), that is, the TBS / NP!
  However, the formula (144) itself, in my opinion, can not fully reflect the value of a degree of implicit interest in symbiosis with the cost of equity capital of the company. In a normal scenario, formula (143) more fully describes the payback period in relation to risk / risk should be incorporated in the calculation of the WACC /, than the formula (144).
  Thus, the formula (143) reflects the payback period in the normal scenario. In this and some other formulas, there is a specific component of T, which we have already seen, - the theoretical income tax rate, it is rarely equal to the statutory in Russia 20% - usually it is different ... .. Those of you Dear Readers who have read my book will probably remember why this is happening ... .. I am very pleased by your attention! Thank you for it! In any case, I will remind you of a conversation about this figure and the line 070 of the profit and loss account.
  This is due to national accounting, reflecting interest paid, which may not exceed the statutory standard (from 2011. Probably should remain standard 1.5 CBRF refinancing rate) - the rest is written off in the accounting records, to indicators such as cost, and in tax records - it increases the tax base ... ..
  That is, the tax lever in 20% does not work on the full amount of the payment of debts - it covers only some part of it (in Russian actual market prices for loans for legal entities). And now you, dear reader, probably, ask me: How to calculate what is the actual value of T in %?
  Alexander Shemetev to determine this quantity has developed the following correction factor T, which allows to use the actual T for each company, while resolving the question of the actual records in the domestic economic T indicators and scientific instruments such as (1-T), with adjustment for features of national accounting. In GAAP and IFRS such a correction can be made for reference purposes of determining the accounting policies - if T is equal to the actual corrective T, the tax reflection goes on the actual fair (market value). If the indicator is not equal so, then either an internal method of determining the fair value is another, or it uses a different method of accounting for such funds.
  Now, let"s go back to the coefficient of correction:
   Now, let’s go back to the coefficient of correction:  [Alexander Shemetev] (145)
   Now, let’s go back to the coefficient of correction:  [Alexander Shemetev] (146)
  WACC (TL%) - is the weighted average cost of capital before the use of tax leverage, that is, the average rate on all borrowings, the calculation of which was already given in this paper.
  Σ070 - is the amount of funds that focus on the 070 line in the profit and loss account as the interests" amount paid for debts, lowering the tax base.
   Ttax - is the normative tax rate on income of legal entities according to the tax regime applied to them.
  Tcorrection - is a correction rate, which shows how many times the tax rate norm differs from the actual tax rate, corrected to the cost of borrowed capital that can"t attributed to low the actual tax rate.
  Ttotal - this is the very T that must eventually be substituted in the above and the following formulas.
  And here, dear reader, the analysis should consider the following. If the ebit formula [Alexander Shemetev] value will be negative, we may get a situation. A company may get net profits, sometimes significant, and, thus, actually go into a major financial loss.
  Net income accounting - this is not the net profit of the company, because the payment of debts, as you remember, not all can be reflected in the account to reduce the tax base. Sometimes, for simplicity, the accounting value of this is conventionally attributed to the cost (line 020 of the profit and loss statement), sometimes in a different account. In any case, the tax records may take only taxable income (the specified portion of the cost of a company is not entitled to be recorded as a loss - this is considered as payment of debts from the company's profit (net operating income)). Then the company could face significant losses in connection with the payment of debts.
  That is why the profitable company, according to the financial statements, may be very much unprofitable in reality and brings big losses, notwithstanding to the high net profit sum written in financial statements.
  That is why in cases, when the value ebit formula [Alexander Shemetev] is negative, Alexander Shemetev recommends you to use not the formula(1-T) - I recommend you to use the lever (1 + T) / it is the formula 147 /, because it does not diminish - it rather increases the actual risk for a company, and much ... .. In any case, it is better to know this feature for you as a financial analyst. It is better to know this, rather than not to know this.... Do you know the saying: "Booked - is forearmed!".
  III) We are with you, dear reader, already touched the themes for pessimistic and normal scenarios for firms" development. Let us now consider the best one, an optimistic scenario and an optimistic version of the payback period of investment. It can easily be calculated by the formula developed by Alexander Shemetev: OC(Eq)
   II) We are with you, dear reader, already touched the themes for pessimistic  and normal scenarios for firms’ development. Let us now consider the best one, an  optimistic scenario and an optimistic version of the payback period of investment.  It can easily be calculated by the formula developed by Alexander Shemetev: [Alexander Shemetev] (148)
  The upper part of the coefficient, I think you already know well, dear reader - this ratio we considered above - this is a developed by the author of this paper payback period of investment ratio.
  The lower part of the formula - is developed by the author of this paper ratio of profitability to the risk of financial leverage, which is the basis for an optimistic scenario: return on equity (OC(Eq)) is higher than the risks associated with the cost of debt capital. If it is not so - then this ratio will show us this, and it will calculate the lifetime of the optimistic scenario.
  It is possible that the payback period on the optimistic variant will increase in comparison with normal. Thus, it can sometimes be obtained, that the payback period on the optimistic version is more than from the normal version - it means that the company most likely do not have good cause for the development of an optimistic version.
  If the payback period of investment for the company's best-and the normal version is more than 10 years, and by pessimistic - 12, this indicates significant risks for the company in the market in Russia. This is due to the fact that the situation in the domestic economic sector since the early 1990s can be characterized as economic instability, which appears as an external set of risks (of macro-and micro- environment). It periodically spills over into the culmination of bifurcation instability - into crises.
  All of this makes medium-and long-term forecasting of the company, in particular, the prediction of activity for a period of more than 10-12 years very difficult, it is very difficult in practice feasible. Therefore, if the company's activities are designed so that the payback period of investment is very large and sharp positive trend is observed over time - in this case such company is a subject to significant risks.
  The lower part of the formula (148) is also a factor showing the degree of financial stability in the market. Now, let's consider the following formula developed by Alexander Shemetev (149):
   The lower part of the formula (148) is also a factor showing the degree of  financial  stability  in  the  market.  Now,  let's  consider  the  following  formula  developed by Alexander Shemetev (149): [Alexander Shemetev]
  This ratio of profitability to the leverage risk (Creturn/leverage risk). It shows if the company's existing level of profitability overlaps the company"s level of financial risk. If the index is greater than 1 - it covers (overlaps). If less than 1 - it doesn"t cover (overlap).
  There is also a more general cost-effectiveness ratio for risk (Creturn/total risk), which assesses not only the risk of financial leverage for the company, and also it assesses the total business risk. This indicator is calculated by the formula developed by Alexander Shemetev (150):
   There is also a more general cost-effectiveness ratio for risk (Creturn/total risk), which  assesses  not  only  the  risk  of  financial  leverage  for  the  company,  and  also  it  assesses  the  total  business  risk.  This  indicator  is  calculated  by  the  formula  developed by Alexander Shemetev (150):  [Alexander Shemetev]
  This indicator shows whether the company provides a stuffed by investors and lenders rate of return on debt and equity. If this value is greater than 1, then the profitability of the company allows it to cover in enlarge the specified rate of return. If not - you should consider: what rate of return the company does not cover: lenders" (risk-based formula (149)) or investors (holders of shares of the company) (Creturn/business risk), which is calculated from a formula developed by Alexander Shemetev (151 ):
   If not - you should consider: what rate of return the company does not  cover: lenders’ (risk-based formula (149)) or investors (holders of shares of the  company)  (Creturn/business  risk),  which  is  calculated  from  a  formula  developed  by  Alexander Shemetev (151 ): [Alexander Shemetev]
  If the index value is above 1, the activity of the company allows it to cover the overall business risk. If less than 1 - it does not so, suggesting the presence of entrepreneurial risk, the fact that the company makes income less than it was included during the planning of its business activities.
  Alexander Shemetev also developed the concept of normalized earnings, which is defined as the minimum constant profitability for the lifetime of the company, which allows it to cover the overall business risk and leverage risk, as well as to cover the cost of equity and debt. The value of this income (ΣNE) for a single company would be calculated by the formula developed by the author:
   The value of this income (?NE) for a single  company would be calculated by the formula developed by the author:  [Alexander Shemetev] (152)
  Where: The value of WACC is taken in its total value (%); Cterm(norm) - this is a normal payback period calculated by the formula (143).
  You should also calculate the (ΣNE) amount under the pessimistic scenario, which would be calculated by the formula developed by Alexander Shemetev:
   You should also calculate the (?NE) amount under the pessimistic scenario,  which would be calculated by the formula developed by Alexander Shemetev:  [Alexander Shemetev] (153)
  Where: Cterm(pes) - it's payback period for the pessimistic scenario, which is calculated by the formula (140).
  Also, for reference, there should be calculated the (ΣNE) value for an optimistic forecast, which will be calculated by the formula developed by Alexander Shemetev:
   Also, for reference, there should be calculated the (?NE) value for an optimistic  forecast,  which  will  be  calculated  by  the  formula  developed  by  Alexander  Shemetev:  [Alexander Shemetev] (154)
  Where: Cterm(optimistic) - this is the payback period of investment in an optimistic scenario, which is calculated by the formula (148).
  This (ΣNE) value shows the minimum amount of profit, which should be earned daily, monthly, quarterly, annually, every 5 years ... and so on - depending on the cutoff frequency. Just keep in mind that you also get a response in the same periods in which you do the analysis (eg, every 5 days). The (ΣNE) quantity must necessarily be generated by a company to offset entrepreneurial risk, leverage risk, minimum level of return to creditors and the estimated rate of return for investors.
  Also financial stability depends on the total profitability of the company in the market: that company can give over 1 turnover of all funds of the company, that is, until it is fully updated in terms of return on investment. The higher profitability of a single company in the industry - the more stable it is: it can afford more expensive market loans; it can be involved to more respectable investors; subordinated partners can expect a better fate in mergers and acquisitions, as well as the rest counterparties in these procedures. Such a firm can grow significantly faster, it can capture new markets faster, upgrade its production lines faster, it can afford more intensive advertising, marketing and PR-activities, and so on .... It all depends on profitability.
  Here I am not talking about the profitability of one year (or other period), which is unlikely to be average, and may be successful or unsuccessful simply by coincidence. Besides, such an average return will be analyzed further, in the relevant part of this paper devoted to profitability.
  I'm talking about a return, which is directly related to financial stability and is its major criterion and indicator. I'm talking about internal project profitability, the value of IRR (Internal Rate of Return - "Internal rate of return on investments in the company", Amer.). However, the IRR is usually associated with something so that is laid in a business project before the start of the company, or prior to the reorganization, restructuring, mergers and acquisitions.
  The important question - is how to accurately estimate the IRR of an existing company in the market and, in particular, when it is not necessarily the company"s assessment goes from the inside.... Moreover, the theory of IRR assumes that the life of the company is an investment project, which has already been laid in the planning stages .... And what if we do not know how many time is rest for a certain company at the market, hence, we can not establish the IRR by classical method ....
  Alexander Shemetev offers a developed by him method for companies" IRR calculating. The method starts of dividing IRR in three versions of the company: optimistic, pessimistic and normal. Also a feature of the author's method is that, initially, the actual IRR is not calculated - it is calculated the minimum value of IRR, which is necessary to minimize long-term business risk and leverage risk, as well as long-term maintenance of a minimum level of return that would completely satisfy the investors / owners of shares of company / and lenders.
  The minimum IRR in the long term for the optimistic scenario is:
   The minimum IRR in the long term for the optimistic scenario is: [Alexander Shemetev] (154)
  Where: TBS - is the book value of the company at a slice for the current date.
  The minimum IRR in the long term at a normal scenario is:
   The minimum IRR in the long term at a normal scenario is: [Alexander Shemetev] (155)
  The minimum IRR in the long run when the pessimistic scenario is:
   The minimum IRR in the long run when the pessimistic scenario is: [Alexander Shemetev] (156)
  Dear reader, please, note, that the (ΣNE) is calculated for a certain period to be used for the IRR calculation.
  The developed by Alexander Shemetev method of calculating the minimum amount of IRR allows to establish whether a company is in fact financially sustainable. If the actual rate of return on profit before taxes (PBT), and even better - on the net profit (NP), exceeds the IRR norm for each case scenario, then this company is absolutely financially stable in terms of stability of shareholders' equity. Dear reader, please, note: the PBT and NP should be taken into an account, when there are no evidences that a company has losses at the same time receiving high profits in its financial statements. The question on how to determine it - was discussed a bit earlier in this paper.
  If a company is not financially stable - we need to analyze to what degree of instability it is located in. In this case, look at the ratio of return / risk ratio has failed/. If rate of return to business risk ratio (return / business risk) became less than it should be, which caused the profitability / overall risk ratio less than 1 - it says that the company has significant signs of latent stage of bankruptcy. This means that the company covers the cost of debt, and it doesn"t bring the normal rate of return for its investors. It can be particularly harmful and quite dramatically for such types of companies as JSC. However, for other types of companies, this means that the business-system is mainly to generate income to its creditors, and only some portion of the profits (lower than expected) it gives to its owners.
  Stage of financial instability begins when the return / leverage risk ratio is less than the critical value of 1. In this case, the rate of profitability / business risk may be greater than 1 (this is normal in the Russian context, where borrowing capital costs much more than the equity capital for most types of companies).
  Stage of financial instability means that the company did not have enough return to cover the debt capital, and as a consequence, a company has been working on its creditors, with all the consequences from this ... .. Financial instability, if the company did not change dramatically, can grow into a stage of explicit bankruptcy....
  The above (ΣNE) indicators are related primarily to the equity of the company, and they reflect only part of the financial sustainability of the business-system on the same index. This indicator can be widely used for the analysis of internal problems within the company, as it is provided with an element of stress testing.
  To establish whether the entire company is financially stable, it is necessary to calculate the index (ΣONE) / Overall Normalized Earnings / developed by Alexander Shemetev, which shows: what is the minimum rate of return that should be given by the entire company as a whole in the long term to cover the entire cost of capital for existence at the market. This figure will be calculated using the same algorithm as the previous one, a bit changed to reflect the totality of the financial sustainability of the company.
  The value of this income (ΣONE) for a single company would be calculated by the formula developed by Alexander Shemetev:
   The value of this income (?ONE) for a single company would be calculated by  the formula developed by Alexander Shemetev:  [Alexander Shemetev] (157)
  Where: The value of WACC is taken in its total (%); Cterm(norm) - this is a normal payback period calculated by the formula (143); TBS - this is the result of the balance, the company"s book value.
  You should also calculate the (ΣONE) amount under the pessimistic scenario, which would be calculated by the formula developed by Alexander Shemetev:
   You should also calculate the (?ONE) amount under the pessimistic scenario,  which would be calculated by the formula developed by Alexander Shemetev:  [Alexander Shemetev] (158)
  Where: Cterm(pes) - it's payback period for the pessimistic scenario, which is calculated by the formula (140).
  It also should be calculated the (ΣONE) value with an optimistic forecast, which will be calculated by the formula developed by Alexander Shemetev:
   It also should be calculated the (?ONE) value with an optimistic forecast, which  will be calculated by the formula developed by Alexander Shemetev: [Alexander Shemetev] (159)
  Where: Cterm(optimistic) - this is the payback period of investment in an optimistic scenario, which is calculated by the formula (148).
  Internal rate of return on the company as a whole in this case would be calculated by the following formulas developed by Alexander Shemetev.
  The minimum IRR in the long term at the optimistic scenario is:
   Internal  rate  of  return  on  the  company  as  a  whole  in  this  case  would  be  calculated by the following formulas developed by Alexander Shemetev.  [Alexander Shemetev]
  IRR of ΣONE is that value - is that return - on that a company will have to generate during the term of return on investment to minimize the risks in the best way possible.
  The mentioned above Alexander Shemetev"s method can used for rapid analysis of business systems, as well as in the same manner can be used the developed by Alexander Shemetev additional ratios.
  Let's consider an example. Suppose that a conventional company JSC "Wave" has a book value of 100 million USD, while the book equity value is 75 million USD.
  There was found that the risk-free rate of interest in investing in government bonds of the U.S. government is 5% (taken as iRF). It was stated by means of the government bond market research.
  It was stated, that the overall cost of capital (WACC) for JSC "Wave" is 12%. It was stated due to the research of firm's internal environment.
  This low rate in Russia was due to a high proportion of equity (whose value is not fixed rigidly), due to relatively low-yield-investors-norm (12% - 5% = 7% yield as a payment for the risk of investing in this industry and this company) and the availability of access to credit from foreign banks, which resulted in a number of long-term loans, on average, by 7.5% per annum. The remainder of the debt is taken in Russia, therefore, it is more expensive.
  It is also known, that the value of WACC (TL%) is 13% (which is the average percentage of all loan capital), and the value of WACC (TL) is equal to 10.5% (the WACC after tax deduction). It is also known, that WACC (OC(Eq)) is 12.5%. It is known that the value of EBIT for the company is 10 million USD, and NP - is 5.9 million USD.
  Let's now, together with you, dear reader, calculate the degree of financial stability and risk of such a company.
  It should be noted that the amount of income tax is not givenfor the organization, and, in this case, it is approximately 20%, which was calculated using the formula for this sample (163):
   It  should  be  noted  that  the  amount  of  income  tax  is  not  givenfor  the  organization, and, in this case, it is approximately 20%, which was calculated using  the formula for this sample (163):  [Alexander Shemetev]
  This formula (163) is good enough in cases when the WACC(TL) is within the norm its sum to be written onto the interest expenses to low the taxable income.
  The formula for cases where the WACC (TL) is not known was mentioned in the present study (see (145) (146)). This formulas are useful for value T calculation if the tax rate by law is known, and the maximum rate of cancellation of the payment of interest on loan capital at the date of the reporting cut-off can be found in the regulatory framework of national legislation.
  Let"s now define default factors:
   Let’s now define default factors: [Alexander Shemetev]
  
  The specified value indicates that the capital of JSC "Wave" should turn around in less than 8.333 years, otherwise the company will not cover the cost of its existence in the market for some of the indicators.
   The specified value indicates that the capital of JSC
  The specified value indicates that net capital does not have time to turn over in 8.333 cycles - for this it needs almost 2 times longer time. Since dividends usually come out of net profits, the company may begin to lose market investors, and, therefore, to lose access to the source of capital. Still there is likelihood that the company does not cover the actual cost of debt capital. Further analysis is needed. Let"s calculate the risk ratio of leverage:
   Let’s calculate the risk ratio of leverage: [Alexander Shemetev]
  This value of risk shows that 1.375% of book value of the company per year is risky in terms of risk of leverage.
  Now, let's get together with you, dear reader, calculate the value of the indicator-rate of business risk:
   Now,  let's  get  together  with  you,  dear  reader,  calculate  the  value  of  the  indicator-rate of business risk:  [Alexander Shemetev]
  This figure shows that 5.625% of book value of the company per year is risky in terms of business risk.
  Let"s calculate the coefficient n, which will be used later:
   Let’s calculate the coefficient n, which will be used later: [Alexander Shemetev]
  This value indicates that the standard period of total turnover of total capital for the company is 18.51 years. This indicator will be used as a degree in determining the timing of capital turnover for the three development scenarios. You probably wonder: Why we need different formulas to calculate the payback period of total capital of the company? The answer is next. The fact is that this formula does not consider such a factor that a dollar now worth more than dollar tomorrow ...., - This is a must for all investors to consider it while investing their money, not to be a loser. Because of this fact, this quantity (n) is estimated and to be used as the degree in respect to the definition of the term of net return on investment for a business-system. In the normal version, the payback period is:
   In the normal version, the payback period is: [Alexander Shemetev]
  Thus, the normal payback period is 18 years, without taking into an account the rules of depreciation of money in the economy (which still reflects the norms of return of investors and creditors who have laid this rule in their return).
  In our example, we found, that the payback period is 164 years with taking into account the implicit interest, rates of return for investors and the value of money depreciation during the time.
  The abovementioned money depreciation norm reflects just a part of financial realities for the sector, where the JSC "Wave" is functioning. This suggests that, despite the fact that the company receives substantial incomes - they are, however, eaten up by ultra-high standards of depreciation of money. This rate of return is usually the result of so-called runaway-galloping inflation .
  Depreciation of money increases the rate of return on investment almost in 9 times. These data confirm once again that, in the galloping inflation conditions it is possible in the first to "dirty" increase the return on investment - to achieve a "clean" growth yield is quite difficult. That is why galloping inflation is often associated with the critical state of the economy.
  We with you, dear reader, saw the Alexander Shemetev's model inputs the factor of depreciation of money and hidden interest for borrowed funds - it, in its turn, increases the payback period for company"s investments in many times!
  Such a high amount of risk is due to the fact that the risk-free rate of return on the market is taken low, while the price of capital - it is high. Or investors push too high demands on the return on their investment, or creditors do so. As a result, there can be found a high proportion of risky capital. It is not necessary to fear of this high number - it gives the possibility to calculate one of the best strategies for the company development in the future.
  This indicator will be used in ratio to yield. If the yield is sufficient - that means the company is able to withstand the specified rate of return requirements of investors and creditors.
  This indicator means that the resulting income for "Wave" company is not sufficient to cover the cost of the existence of firm at the market. This analysis shows the payback period on the major risks. Further analysis is necessary. In the worst case scenario payback period is:
   Further analysis is necessary. In the  worst case scenario payback period is:  [Alexander Shemetev]
  It is seen that in case of crisis and instability in the external environment, the company has virtually no chance to recoup the investment. Such a company in the event of instability in the external environment will periodically cover a shortage of liquidity through debt sources of funds.
  Despite rather large profit margins, return on investment period of 18 years, excluding depreciation of money and rates of return of investors and creditors, increases the actual payback period of capital to an impressive size. To find out whether there is a chance of developing of the company's market, you should analyze the optimistic scenario. And before it, there should be set the measure of the profitability / risk of leverage:
   And before it, there should be set the measure of  the profitability / risk of leverage:  [Alexander Shemetev]
  Thus, the profitability of the company is sufficient to generate revenue in the short term. And since even the payback period in the best-case scenario is more than 10 years, this suggests that long-term existence of such a company is almost impossible, if the situation does not change drastically for the company in the better way - it is likely that the optimal strategy for a company should be the "cream skimming" with the subsequent sale of the business and its units at the maximum price, if it is not expected to improve the situation for a company associated with an increase in its yield of 3.5 - 16 times.
  If the payback period in the best-case scenario would be 10 years or the same, provided that for a foreign company (there an optimistic payback period is of 30-35 years - it is the limit), then it would mean the following. The whole fate of the company would depend on the marketing cycle, and communications with shareholders, and that an alternative strategy for such a company would be to expand the market for resale the company, for example, by means of stock market during the peak of the liquidity that could be artificially achieved, for example, by borrowing capital or additional issue of securities to be able to send the proceeds to a temporary extension of activities in order to be seem more attractive to subordinated investors (those investors who focus on the potential purchase of control of public companies or a merger).
  And if the normal payback period would go down to 10 years for Russia or abroad for 20-25 years (if there is debt or equity is cheaper), then the company would be a sufficiently self-sustaining. In this case, we can move the strategy to the modernization of production facilities the company to meet the current level of market development not just in present and also in the long-term future.
  Such a company could exist very long in the market, in the case, again, of the lack of bifurcation transformations, the dynamic crisis changes in the environment, however, the agility of a company functioning under such conditions would be substantially higher. Let"s go back to the analysis of JSC "Wave". Let us now examine the rate of return / total risk for the firm:
   Let’s go back to the analysis of JSC
  This value indicates that the company needs from one year to generate income to 9 million USD, so this enables them to minimize the risks, that is, to be able to cover the risks of leverage and business risk, as well as, to be able to compensate investors"/equity holders of the company/ and creditors" rate of return without prejudice.
  Yes, the company generated revenues of 10 million USD, and this income is only 5.9 million USD clean - the rest goes to cover the taxes and fees on loans resources. The company's crisis is caused by the annual shortage of more (9-5,9 = 3,1 million USD) extra.
  Then you should see the pessimistic variant for ΣNE:
   Then you should see the pessimistic variant for sum. NE:  [Alexander Shemetev]
  Revenue in the pessimistic version is comparable with normal income of 9 million USD. This shows that the increase in net income of 3.1 million USD per year will make the company stable, in particular, in the case of severe crisis trends of the environment. Therefore, company needs to somehow expand its operations, using a strategy of growth, while there is still a possibility, while the company still has high maneuverability, expressed in a positive liquidity, profitability, net worth, and so on. High payback period indicates that the company will be difficult to upgrade its production arsenal that could gradually make the company's products and the business-system itself much less competitive.
  The presence of additional 3.1 million of NP in a year would significantly improve the performance of the company. Let"s make the Wait-if analysis. As you recall, this type of analysis - is a form of company"s stress-testing. So, the script: improving yield of 3.1 million USD a year. Financing options:
  Option 1. Attraction of additional TL (borrowed funds) in $ 30 million USD with the same average cost of capital, resulting scenario is that the company began to have EBIT by 50%, resulting net income is increased to 9 million USD. In this case, n = 20; Cstimterm = 8.33 (no change); Cpayterm = 14.44 (down 17.3%); Cterm(pes) = 207 (+ 15.4%); Ctermnorm = 194 (+ 15.6%); Ctermoptimistic = 44.3 (+29.3%). NEnorm = 8.74 (it completely satisfies the condition in 9 million USD).
  Thus, it was found that the risk is expected to increase by about 15.5% in case of involvement of the specified amount of funds in the specified way. At the same time, marketing and management risk will increase approximately by 29%. However, in case when such a risk will achieve revenue growth up to 9 million USD, it is able to cover the rate of return of investors and creditors of the company. However, long-term development of such a company is not quite possible, due to excessive of long-term market risk on average in more than 9 times (the sum of all three (Cterm)s divided by 3 and divided by 9). However, the financial risk will be within the norm. As for the return / risk of leverage ratio - it is expected to increase itself by 19%, and profitability / business risk is expected to fall by 33%, which may lead to massive sales of shares in case of sudden changes in conditions of crisis at stock markets.
  Option 2. Change in the market: there is an alternative for risk-free investment of capital (it appears). Risk-free rate is increased by 4%. Other parameters are not changed.
  In this case, Cstimterm = 8.333; Cpayterm = 16.94; Cterm(pes) = 168.9; Cterm (norm) = 164.0118; Cterm(optimistic) = 8.54 (a growth in 3.66 times!); Creturn/leverage risk = 19.2; Creturn/total risk = 2.4.
  So, if there are such favorable economic conditions that dictate both the high cost of capital and risk-free yield possibilities (9%), then, even in this case of worst-case scenario, the total development of the company will not be changed significantly.
  However, the optimistic scenario started to show that both: revenues in this economy and the purchasing power of society and the business sector as a part of it, - they grew up significantly due to the large number of high-yield risk-free opportunities!
  Therefore, it is possible to recover all investments in equity. It is necessary to ensure the profitability in 14.5 million USD per year: in this case, investment will pay off for 8.54 years. This term for rate of return, in particular, is dictated by the Russian domestic economy.
  Option 3. The company found a subordinated investor who agrees to provide the company with subordinated investments (in terms of obtaining the right to participate in the management and revenue) in $ 30 million USD. It is expected that the company's EBIT will rise to 15 million USD, while net income - up to 9 million USD.
  In this case: Cstimterm = 8.333; Cpayterm = 14.44; Cterm(pes) = 83.07; Cterm(norm) = 77.55; Cterm(optimistic) = 10.07; n = 13; Creturn/leverage risk = 7.67; C return/total risk = 1.43; NEnorm and NEpes = 12.72. IRR (optimistic, full IRR) = 12.11%=IRR in other development scenarios.
  The conditional data should be taken for the wait-if analysis, and then the approximate variant of events development is to be calculated both in case of occurrence and in case of non-occurrence of some certain events and events" groups. Then, it can be forecasted to what direction a certain company"s development should go to, based on the data collected from the wait-if analysis. It can also be forecasted what is the favorable outcome and the consequences of this favorable outcome and its consequences that may arise if the company achieves its goals and objectives.
  Alexander Shemetev proposes the following algorithm for wait-if analysis. First, it calculated how much profit or loss a company wants to get or to get rid of in the long and medium term, or what is the optimal structure of capital it wants to receive.
  After this, there should be considered due to which financially a company can achieve such a result: by increasing its activity by attracting additional investment; by the gradual expansion at the expense of the planned increase in sales; by expansion of its activities at the expense of borrowed capital; by the expansion due to a change in market conditions for favorable ones, ....
  At the same time, the not favorable scenarios should be calculated for a company.
  Then financial indicators should be calculated for each such version of the company development, and also the resulting effect should be assessed.
  This is how a pattern of development and company"s strategic priorities can be made, as well as, it can assessed due to which factors a company may achieve the forecasted market position in the future.
  It should be noted that the probability of the company"s development by a particular "path" should be carried out by, firstly, market analysis, which aims to establish the exact probability of such a scenario. The market analysis is discussed in my Russian book, as well as in my English papers.
  Let us now return to our example. Based on further analysis it can be established that IRR from company"s total capital (the thing that the ΣONE assesses) for all the three scenarios will be equal to 12.1163%. This average value shows: what is the profitability that should be generated by the company"s functioning, in its minimal norm, to over-cover the cost of total capital usage and to satisfy the income norms of investors and creditors in their full value.
  In the above example, the company lacks the 6.21 million USD of net income, which suggests next: despite the fact that the company receives substantial income - the rates of depreciation of money in the economy are eating all the profits of that company. It was stated next on the basis of wait-if analysis on the Alexander Shemetev"s method. The most favorable trends in the company"s development are not in raising an additional debt. The most favorable trends in the company"s development are "hidden" behind either the change of market conjuncture to a favorable one, or search for a subordinated partner.
  In both cases, only the optimistic payback period turned out OK. This suggests that the success of a company directly depends on the success of the marketing cycle: the firm will have to realize a marketing program of development in a short time. The optimistic forecast to become true, company needs to increase quickly its potential.
  Very expensive capital - is a major cause of hidden stages of bankruptcy within the domestic companies, and it also an often cause for open stages of bankruptcy. Many companies do not adequately consider the rules of depreciation of money, particularly in Russia, with galloping inflation conditions. This leads to the fact that many local companies, despite a substantial increase of income from the activity, however, each year, in fact, have substantial losses, losing market share and, thus, creating opportunities for their competitors.
  This is why the developed by Alexander Shemetev method is very urgent technique, which allows you to see how high there should be company"s profitability to meet all standards of return of investors and creditors. As you, dear reader, understood, by creditors I mean a wide range of providers of debt capital for a company.
  These techniques allow us to calculate how much money should be earned by a company per annum to cover the cost of borrowed capital, capital depreciation norms and the rate of return on investment, as well as the manner in which company should develop its own strategy to reach these figures. Thus, we can calculate the actual financial sustainability of individual company in the market.
  In addition to financial stability there is the concept of liquidity, which we have already seen, in particular, studying the technique of Natalya Gordo (do you remember, she invented to divide the Russian companies capital into 4 asset and liabilities groups in a specific manner it to be best matched for Russia). Let's now take a look at how to conduct a comprehensive analysis of liquidity in a company.
  Comprehensive analysis of liquidity in business-systems
  Liquidity .... For many years, companies and business in general are faced with the most insurmountable dilemma itself in the world: either to act in the market so that liquidity to be the maximum, or to put all to business-turnover to get more profit in the future.
  In the end, - said problem is reduced to a more global: high yield in high-risk or moderate yield with a moderate risk.... And there appear three financial strategies, depending on the three (already psychological rather than financial) types of investors: conservative, moderate and aggressive. Conservative strategy always involves the avoidance of risk and market share retention. With regard to liquidity, such a strategy means ensuring maximum liquidity, which should minimize the risk. However, conservative companies" profitability is, generally, much lower than that of their opposite side - aggressive companies. However, the risk of bankruptcy among these companies is usually in several orders of magnitude smaller than of the others. However, the practice of the market is such that the conservative companies, in the long-term-trend, tend still to be gradually replaced from the market by more aggressive competitors.
  The direct opposite of a conservative strategy is an aggressive strategy, which involves a high yield with high risk. With regard to liquidity, this means minimal or virtually no liquidity in high yield. Paradoxical as it sounds, in Russia there are practically very few aggressive companies! This is due to the extremely high cost of borrowed capital in Russia. This price is so high that the company simply has no time to be aggressive: its creditors in most cases simply "eat" such companies. Perhaps the only exception to the rule could be regarded to the banking sector companies, which clearly defined for themselves: an aggressive strategy - is the key to success! All over the world, this is quite a common practice for banks! Because of this reason, in the world today has occurred, in particular, the current banking crisis.
  This is usually what happens in the aggressive strategy: a high yield + risk, and if something is wrong, if something risky happened unexpected .... here start to work a bifurcation theory of the explosion, which literally swept away all such companies from the market.
  However, some investors do not want a slow displacement of their company from the market, and also they do not need very high risks too. They are willing to sacrifice some yield in favor of providing a "safety cushion" in the form of a moderate liquidity, which should save them in case of sudden crisis trends in the external environment. And even here there is a shortage: Moderate companies are experiencing difficulty with prolonged crisis trends of the environment.
  As you know, no one strategy will save the company both in Russia and in other countries from bankruptcy.
  Even in the most stable developed countries in the world there are their "minus millionaires" in all the three "weight" categories: Ruiz Mateos and Adnan Khashoggi were of a conservative strategy, John Bloom and Jim Slater - were of moderate strategy, Kate Hunt and William Stern - were of aggressive strategy. We have already briefly discussed who they were and what they did do.
  So, I, together with you, dear reader, have come to a very important issue for any business: liquidity. Liquidity - is an individual ability of each asset to turn into money after a certain time. Freely exchangeable currency plus a national currency (for Russia - it is ruble) have the maximum liquidity. It is so by the definition of money themselves. Many individuals and legal entities are ready to exchange for them everything they can immediately.
  All other assets have significantly less liquidity than money. Liquidity is associated with the time and cost. Illiquid asset can be sold much more quickly if to include a discount in its sale.... Conversely, the liquid asset can be sold after a long period of time, if you put a high price for it....
  The cases with liabilities are very similar to what we"ve seen before, with one difference: there is another term that is used for liabilities - "promptness of return", instead of "liquidity".
  1) The classical theory of aggregation in the financial analysis of liquidity
  There is a classical theory of aggregation. And you should know that it works only when we are uniquely able to break the company's assets for current and noncurrent, and liabilities - for short-term and long term. It can be difficult to do this for some kinds of companies, because of their nature: for example, it doesn"t make sense to stress the current and non-current assets in banks, at the same time, they have to deal with liquidity of assets and maturity of obligations - it is in the nature of banking activity.... Let"s speak in some other aper about such types of companies as banks. And now, let"s go back to the classical theory of aggregation:
  According to this method, all assets and liabilities are divided into the most active and most urgent, quick-and short-term, slow-moving and long-term, and permanent:
  1. The most liquid assets (MLA) - assets that can be instantly re-converted to cash. These include, firstly, the monetary funds themselves, and secondly, all short-term investments that we can sell quickly (eg market shares):
  MLА = line:250* + line:260 (164)
  2. Quick-assets (quick in realization assets QiRA) - these are assets that can be relatively quickly converted into cash, and this, however, needs some time. These include: Accounts receivable maturity of up to 1 year and other current assets:
  QiRА = line:240 + line:270 (165)
  3. Slow-moving assets (slow in realization assets SiRA) - these are assets the realization of which takes time, usually within 1 year or more. These include accounts receivable with a maturity of more than 1 year, stocks/inventories except for prepaid expenses, VAT on purchased goods and long-term investments:
  SiRА = (line:210 - line:216) + line:220 + line:230 + line:140 (166)
  4. Illiquid assets (difficult in realization assets DiRA) - these are assets that are intended for use in the production of the company, so they are also called fixed assets. Their realization will be linked with the sale of capacities of an enterprise, which could take a very long time. The DiRA includes all non-current assets (ImmA), except for long-term investments, which, though with difficulty, we can sell within a year or a little more:
  DiRА = line:190 - line:140 (167)
  The first three groups of assets (the most liquid assets, quick-and slow-moving assets) during the current financial period may fluctuate and migrate in groups of more liquid assets over time or due to changes of other factors. Gradually, these assets are being transferred to groups QiRA and MLA.
  Liabilities are grouped together on terms similar to the assets:
  1. The most urgent obligations (most time-critical liabilities - MTCL) - these are obligations to pay in the nearest future. These include accounts payable, payable to the founders (participants) of the company and the not-repaid-on-time-loan (according to the appendix to the balance sheet):
  MTCL = line:620 + line:630 + line:670 (168)
  2. Short-term passives (liabilities) (STP) - these are short-term bank loans and credits, and other loans repayable within 12 months after the reporting date. This includes Loans outstanding to shareholders (founders) for income payments.
  STP = line:610 (169)
  3. Long-term passives (liabilities) (LTP) - these are all long-term liabilities of the company (line 590 (Total liability: balance section IV)), as well as some lines of section V of the balance not covered by the previous group: Deferred revenue, current liabilities and Other Provisions for liabilities and charges. Then, standing liabilities should be reduced by the amount of expenditure in future periods:
  LTP = line:590+ line:640 + line:650 + line:660 - line:216 (170)
  4. Permanent passive (liabilities) (constant passive (CP)) - only the total sum of III part of balance sheet is referred to it ("Capital and reserves", or equity capital total sum):
  CP = line:490 (171)
  It is believed that a company has a good liquidity, if its current assets exceed its current liabilities. Liquidity of the company may differ from the ideal in larger or smaller sides. In order to determine the direction in which the different companies" liquidity moves and to find out where it necessary to raise its own funds for a certain company - it is necessary to analyze the liquidity: the company"s obligations coverage by its assets available, broken down by maturity. As it is mentioned above, ideally, the term of assets" transformation into money must comply with the obligations arising from maturity.
  The balance will be totally liquid, if the following conditions are fulfilled:
  MLА ≥ MTCL;
  QiRA ≥ STP; (172)
  SiRA ≥ LTP;
  DiRA ≤ CP.
  
  Where: MLA - the most liquid assets; MTCL - the most urgent liabilities; QiRA - Quickly realizable assets; STP - Short-term liabilities; SiRA - slow-realizable assets; LTP - Long-Term Liabilities; DiRA - Hard realizable assets; CP - Fixed Liabilities.
  If the first three inequalities hold themselves true, ie current assets exceed external liabilities of company, then the last inequalities holds itself true too, which has a deep economic sense: the existence of the firm's own working capital (ie, the equity net worth must exceed company"s own ImmA reduced by the amount of long-term financial investments).
  In a comprehensive financial analysis of companies theory, it is believed that in this case, and only in this case, the minimum requirements of financial stability of a company are fulfilled.
  More often it happens that some, at least one, inequality of the system fails. There is nothing bad for business in it - it just means that its liquidity in some way different from the ideal. Even if all the inequalities are not satisfied, that is, the firm is absolutely illiquid - this does not mean that the business-enterprise is "bad."
  It can be quite the opposite - the company simply does not have any liquidity now at the moment, and that the flow of its own liquid assets (for example, receipt of revenues due to improved market conditions, capture new markets and so on) will override the lack of liquidity in the future for such company. And if the failure to manage these inequalities can bear nothing bad for a company, it nevertheless would be "the sign" for company"s creditors that in the event of a deep crisis such firm will hardly be able to repay fully all its obligations!
  2) Coefficiental approach to financial analysis of liquidity
  Liquidity ratios are changing both in time and in their "the qualitative components" composition" for companies. The calculations of these coefficients should show the presence of liquidity in the company. It should reveal next: the presence of company"s solvency and creditworthiness, and also a factor to restore the solvency in an emergency situation.
  The most important for lenders solvency assessment is in current liquidity ratio
  Current liquidity ratio (Cclr) - is the primary liquidity ratio of an enterprise, which shows how many dollars and cents can approximately be accounted during a year for a dollar of company"s short-term obligations. If it is less than the value of 1, 1 dollar of short-term obligations doesn"t meet a fully equal dollar to meet each such dollar of obligations within a year.
  Ideally, the value of this ratio should be 2 or slightly higher; for industrial enterprises - the value of this ratio should be at least greater than 1 (sometimes it's very efficient)! If its value is much greater than 2, it also is undesirable, because it may be associated with slowing down the turnover of funds invested in inventory, the unjustified increase in receivables, with existing unsustainable investment to liquid resources!
  This ratio is the ratio of realized within about a year assets to current liabilities, and it is determined by formula:
   This ratio is the ratio of realized within about a year assets to current liabilities,  and it is determined by formula:  [] (173)
  This factor, like all other liquidity ratios, one must look at the dynamics. Low values of the coefficient indicate a high risk of insolvency.
  Quick liquidity ratio (Cqlr) shows how many dollars and cents of current assets (term assets minus inventories) are accounted for 1 dollar of Current debt (liabilities)! It can be calculated by the formula (174):
   It  can  be  calculated  by  the  formula (174):  []
  
   Liquidity ratios matrix system [Alexander Shemetev]
  
  This factor helps to see: whether a company has an opportunity to repay its obligations, if it fails to sell its stocks, for example, in a tough economic crisis!
  The recommended value of the coefficient should be above 0.8, ideally - a little higher than 1. If the coefficient is much greater than 1, then there may be a high percentage of accounts receivable in the enterprise, or mismanagement of liquid resources in the enterprise, which could slow down company"s functioning, reducing the effectiveness of its activities!
  Absolute liquidity ratio (Calr) - this is the most liquid ratio! It shows how much of "almost cash" (Ready Money) can be accounted for each dollar of current liabilities. Ready money - this is, firstly, the monetary funds themselves, and, secondly, the assets of instant liquidity (which can be exchanged for money within about three days) In the Russian reality, this ratio is calculated as follows:
  
   Ready money – this is, firstly, the monetary funds themselves, and,  secondly, the assets of instant liquidity (which can be exchanged for money within  about three days) In the Russian reality, this ratio is calculated as follows:  [] (175)
  Let"s now consider the matrix system of the main indicators of liquidity for a company, made up by the author of this paper, and let"s analyze it together.
  Absolute liquidity ratio - is the first test of solvency, which brings to business owner a clear condition: "Can you pay all the debts using Cash-funds only"? Of course, if that happens, then why should they take the credit, if they have money of more than enough. Therefore, the recommended values for Russia - is 0.2, and it should not be less than 0.1. That is, ideally, the company must be prepared to pay at least 10% of its ongoing commitment "immediately", ie, about three days or a week.
  This ratio is the most stringent criterion of ability to pay, and shows how much short-term debt the firm can pay off in the near future. Its magnitude should not be below 0.2.
  The coefficient of L5 (176) shows the proportion of the most liquid assets in the book value of a company.
  Along with the above ratios, Alexander Shemetev offers you a number of additional liquidity ratios for a company. These ratios" ways of calculations were developed by the author of this paper in order to analyze analyzing the structure of the company's liquidity. These ratios were based on simple ratios, re-interpreted to the terms of liquidity and obligations maturity terms.
  The value of net working capital (NWCv) is calculated by the formula:
   The value of net working capital (NWCv) is calculated by the formula:  [] (177)
  This figure (NWSv) shows the maneuverability reserve for a business. The higher this value - the better it is for a company. The maneuverability reserve for a business indicator (Cmr) itself is calculated by the formula, developed by the author of this paper:
   The maneuverability reserve for a  business indicator (Cmr) itself is calculated by the formula, developed by the  author of this paper:  [Alexander Shemetev] (178)
  The ratio of equity to debt in terms of liquidity (Coc-td-l) is calculated by the formula, developed by the author of this paper:
   The ratio of equity to debt in terms of liquidity (Coc-td-l) is calculated by the  formula, developed by the author of this paper: [Alexander Shemetev] (179)
  This indicator also measures the overall mobility of capital in relation to liquidity. The indicator for any company should not be below 11% (threshold values of the Cook ratio for Russian banks).
  The overall financial sustainability through the lens of liquidity will be considered by the coefficient of specific liquidity, developed by Alexander Shemetev (Csl):
   The  overall  financial  sustainability  through  the  lens  of  liquidity  will  be  considered  by  the  coefficient  of  specific  liquidity,  developed  by  Alexander  Shemetev (Csl): [Alexander Shemetev] (180)
  This factor developed by the author of this paper shows, through which liquidity the overall financial stability is formed, and by what means it decreases itself.
  Coefficient of funds" mobility (Cfm) is calculated by the formula, developed by the author of this paper:
   Coefficient of funds’ mobility (Cfm) is calculated by the formula, developed by  the author of this paper:   [Alexander Shemetev] (181)
  The specified ratio, developed by the author of this paper, shows how quickly mobile and fast-in-attraction to use, including, to use to pay the obligations, is the balance-sheet structure of company.
  The ratio of liquidity supply of own funds (Clsof) is calculated by the formula developed by Alexander Shemetev:
   The ratio of liquidity supply of own funds (Clsof) is calculated  by the formula  developed by Alexander Shemetev: [Alexander Shemetev] (182)
  The specified ratio developed by Alexander Shemetev intended to show where liquid sources are formed from; it is the main indicator of financial stability of the company: the own funds ratio, which should be more than 0,2 (0,1).
  The coefficient of self-coverage of long-lived assets (Csclla) is calculated by the formula, developed by the author of this paper:
   The coefficient of self-coverage of long-lived assets (Csclla) is calculated by the  formula, developed by the author of this paper: [Alexander Shemetev] (183)
  This coefficient shows if it is enough of owned funds to cover the cost of production-oriented non-current assets.
  It should also be noted the developed by Alexander Shemetev liquidity ratio of equity capital mobility (Clrecm):
   It should also be noted the developed by Alexander Shemetev liquidity ratio of  equity capital mobility (Clrecm):  [Alexander Shemetev] (184)
  This coefficient indicates the mobility of financial assets of the company. It is cleared of non-productive fixed assets, and it can give further insights on the distribution of liquidity and ongoing obligations of the firm.
  Alexander Shemetev has developed a liquidity ratio of long-term borrowing (Clrltb), which is calculated as follows:
   Alexander Shemetev has developed a liquidity ratio of long-term borrowing  (Clrltb), which is calculated as follows:  [Alexander Shemetev] (185)
  This indicator determines what proportion is of long-term-commitment-to-the-execution in a permanent capital. This is a permanent structure of the company's liquidity.
  Alexander Shemetev has developed an interrelation coefficient of liquid liabilities (Cicll):
   Alexander  Shemetev  has  developed  an  interrelation  coefficient  of  liquid  liabilities (Cicll): [Alexander Shemetev] (186)
  This coefficient indicates the percentage of commitments to the execution in permanent liabilities of a company. If the index is greater than 1, it means that the share of obligations to fulfill is more than own funds sum, in the amount of times corresponding to the numeric value of the coefficient.
  Along with these factors, it is necessary to calculate the proportion of each asset in the company property (Cap) for the financial analysis, which can be calculated using the formula developed by the author of this paper:
   Along with these factors, it is necessary to calculate the proportion of each asset  in the company property (Cap) for the financial analysis, which can be calculated  using the formula developed by the author of this paper:  [Alexander Shemetev] (187)
  Where: Cap - is a measure of the proportion of liquid assets in a specific property of the company; LA - these are the analyzed liquid assets (MLA, QiRA, SiRA or DiRA).
  Similarly, it is necessary to calculate also the share of term liabilities in the company's passive (Ctel), which can be made by using the formula developed by the author of this paper:
   Similarly, it is necessary to calculate also the share of term liabilities in the  company's passive (Ctel), which can be made by using the formula developed by  the author of this paper:  [Alexander Shemetev] (188)
  In addition to this, let's look at some additional liquidity ratios, which were developed by different specialists. All professionals, in general, are similar in that it is necessary to calculate the coefficients of absolute, immediate and current liquidity, and also the balance sheet liquidity of the equation (formulas L1, L2, L3, L4 from the matrix system of basic indicators of liquidity of a company). In addition they recommended that you make the calculation of about 5 or 2 ratios more. Let's look at them.
  The coefficient of the total balance sheet liquidity (Ctbsl):
   The coefficient of the total balance sheet liquidity (Ctbsl): [] (189)
  This indicator shows, like L1 do, whether the company can cover all its obligations arising from existing assets.
  Coefficient of prospective pay-ability (Cppa):
   Coefficient of prospective pay-ability (Cppa): [] (190)
  This coefficient indicates whether a company can pay its obligations in the long run.
  Debt ratio (Cd):
    [] (192)
  It shows: how many cents of long-term commitment a company has to each dollar invested in the company's assets.
  The coefficient of total pay (Ctp):
    [] (193)
  It shows: how many loans happen to long-term assets.
  A. Vasina proposes to use for the analysis of the liquidity a coverage ratio of a single cash account (Crsca):
    [] (194)
  Where: ODS - this is the actual balance of cash on the balance sheet (line 260 in Russian balance), which sometimes can be added to the analysis to line 250 in Russian balance (short-term investments). OP - this is the expressed in days length of the period. ZDS - is a figure calculated by the formula (195):
    []
  Where: Cost - it costs (line 020 of the profit and loss statement); Barter - is the percentage of barter in the cost / which must be obtained from the finance department or accounting department /; Am - is the amount of depreciation for the period; T - is the value of income tax ; InvG - this is an increase in inventories for the period (an increase of 210 line of balance).
  It should be noted that almost all domestic companies by this method will have liquidity ratio of less than 1 day (by check)! This is not to be frightened, as well as to understand that one day they go bankrupt. One should take this factor as a reference indicator.
  Now, let's move on to the next step of financial analysis of the company - valuation of financial results.
  Assessment of financial performance of business systems
  The financial result .... It usually comes in two basic types: profit or loss. However, analysis of financial results - is a much broader concept than just an analysis of the company receiving a profit or a loss. In this paper we have often touched various measures of financial performance of companies in the market. Just now we come to the aspect of the need for this type of analysis of the company in the market.
  Assessment of the financial results of the business-system consists of two main stages.
  At the first stage, it is analyzed the main indicators" dynamics and the movement of funds received: from sales to the net income and on ....
  In the second phase, there are analyzed the relative indicators of the legal entity functioning by means of relative indicators. The relative indicators, in their turn, can be divided into two types: marginal figures (from the English. Margin - "margin", "profit" - a measure of profitability, the effect of production, the difference between money received and money expended) and indicators of business activity (the performance of the different cycles of the business turnover in the company from total capital in general to a variety of small targets).
  Well, now we"ve seen what is this type of financial analysis consists of - let"s now proceed to consider the first part of the analysis:
  1) Analysis of the dynamics of the profits
  The general scheme of the analysis in this study will be reflected in the table below.
  Table: Analysis of the dynamics of the profits
  Table: Analysis of the dynamics of the profits  [Alexander Shemetev]
  
  The rows 2 and 3 are made from the data from form number 2 - "Profit and Loss statement", or data from accounting departments. Next, it is the share index in percentage of total revenues. It is possible to calculate it , for instance, in Excel, if you choose a formula to fix the balance sheet total cell by F4 key pressing, and then drag the marker - the computer finds it automatically.
  You know the percentage of net profit (NP), Revenue (rev), costs, taxes payable, other expenses and incomes selected for the analysis of the company.
  Particular attention should be paid to the cost - this is a general recommendation for all businesses! Cost must always be lower and lower in all ways possible, and no to effect on product quality and other aspects of the marketing policy of the enterprise. Therefore, special attention from you will require the preparation of the cost structure.
  All lines of "Profit and Loss" in complex analysis are given for a general idea for the company's unique structure of income and expenses. For example, there are enterprises which make up most of the revenue in this year's operating income, and there are such types of incomes as extraordinary incomes or, and this is very bad, the extraordinary cost! Hurricane, swooped locusts, there was a fire, robbery or something else - something bad ....This can greatly affect the financial performance! Therefore, if the balance sheet can be viewed slightly to save time, the "Profit and Loss statement" - never! You can make a brief analysis of the table, and be sure to analyze, at least, in your mind, the same way all the "Profit and Loss statement ".
  "Profit and Loss statement"s" data is very important for the analysis of the company.
  2) Cost-benefit analysis and business-activity analysis
  Cost-benefit analysis for firms - is a very important indicator for each firm. For simplicity of perception and understanding of this aspect of the business, I created a table that clearly and extremely accessible set out all the trends in profitability and business-activity of firms.
  In the proposed by me system, there are indicators of cost effectiveness below, in the matrix; you'll see them in the group indices M, on all major aspects of the business. Also, this matrix system uncovers assets turnover and firm's capital turnover; you'll see them in a group of indicators T. It also shows the average time rates of turnover of capital and assets of a firm. You can find them in the coefficient group A. This matrix system should also be given considerable attention to the main performance indicators of the company; you will find them in a group of indicators Y. A calculation of the stock performance and their coefficients can be found in the group S. Let's now look at this matrix system and analyze it with you:
  
  
  Matrix system name [Alexander Shemetev]
  Matrix system of financial effectiveness [Alexander Shemetev]
  Matrix system of financial effectiveness [Alexander Shemetev]
  Matrix system of financial effectiveness [Alexander Shemetev]
  Matrix system of financial effectiveness [Alexander Shemetev]
  Matrix system of financial effectiveness [Alexander Shemetev]
  Matrix system of financial effectiveness [Alexander Shemetev]
  Matrix system of financial effectiveness [Alexander Shemetev]


  EBIT - Earnings Before Interest and Taxes - Income before interest and taxes.
  NOI - Net Operating Income - Net Operating Income.
  EBITDA - Earnings Before Interest, Taxes, Depreciation and Amortization - Earnings before interest, taxes, deductions for normal maintenance, depreciation and amortization.
  PBT - Profit rate without qualification (usually it corresponds to PBT - profit before taxes), which means that here, in fact, can be calculated by two factors: the operating income and net income. It should create a more detailed picture of company as well as a picture of tax deductions impact on key financial indicators. These two indicators have an important difference to the company's management in Russia. Net income - is a line:190 of "Profit and Loss statement", and operating profit - line:140 of "Profit and Loss statement ".
  NP - Net income (profit/loss) - is a string of 190 of "Profit and Loss statement".
  COST - Cost - is a combination of all direct costs associated with the production for the period analyzed; it is the total value of line: 020 of "Profit and Loss statement".
  Rev - Revenues - represents the entire amount of funds received by the enterprise from all types of its operations for the period under review; it is the total value of line: 010 of "Profit and Loss statement".
  OC(Eq) - equity (line: 490);
  TL - Gross Debt (Total Liabilities) - The amount of the IV and V sections of liability in balance (line: 590 + line: 690);
  FG - Finished products (goods) (line: 214);
  ImmA - Non-current assets (line: 190);
  MobA - Current assets (line: 290);
  Inv - Inventories (line: 210);
  LTL - Long-term liabilities (long-term debt) (line: 590);
  FA - Fixed Assets (line: 120);
  RM - Materials: raw materials and other similar inventories (line: 211);
  TBS - The overall result of the balance sheet (line: 300 or line: 700);
  AP - Accounts payable (line: 620);
  STL - Short-term borrowings (Liabilities) (line: 690);
  AR - Accounts receivable (lines: 230 + 240);
  Div - Dividends payable - Total of line: 170 in # 4 OKUD Form in the Balance: "Statement of Cash Flows".
  DivP - Dividends on preferred stock payable;
  DivO - Dividends on common shares payable;
  AvN(OS) - The average number of ordinary shares for the year;
  MPoS - The market price of shares, which is taken on the average for the period;
  S2 - the coefficient of S2 (1.75) in the table of coefficients.
  AvCosOC(Eq) - The average cost of equity for the period - a result of line: 490 in Balance at beginning of period taken plus at the end of the period, divided by 2, that is, the arithmetic mean of the OC(Eq) at the beginning and end of the period.
  MPF - basic production assets (Main Production Funds) - is the result of line: 190 Balance ("Non-Current Assets") minus line: 135 of Balance ("Long-term investments"). Subtraction is because, if we, for example, have leased some fixed asset in the long term, it has nothing to do with the MPF, because it is associated with the production indirectly.
  + / - - Shows that the coefficient has no rigidly fixed standard: it is necessary to look at the dynamics, as well as within the meaning of this factor.
  Now I will describe in more detail provided in the table financial ratios.
  Group M - Margin Ratios - literally: "Margin ratios", ie, it is the difference of income and consumption of enterprises in relative terms, or profitability of the company on 10 of the most important aspects.
  Group T - Turnover Ratios - it is the turnover of the company in relative terms by 9 basic aspects of turning the company"s money around.
  Group A - Average Turnover Terms Ratios - these are the measures of the average time of turnover of the company"s funds on 8 basic aspects of funds turnover, which are expressed in days per annum.
  * - Indicates that the term was taken as the default in 365 days. And one may also take other periods: The average year (360 days), Half-year (180 days), Quarter (90 days), month (30 days), .....
  Group Y - Yield on X Ratios - performance of the company on 4 main areas;
  Group S - Shares Ratios - these are the performance Indicators for interrelations with shareholders of the company (if any), on six main areas.
  In these groups there are three coefficients with different designations and thresholds, but the same actual values. These factors reflect the three different spheres of activity: Operating, investing and financing. This should be considered in the overall financial analysis company.
  M1 - Return on sales (Sales Margin) - Shows how much profit falls on a dollar of sales.
  M2 - Return on equity - Shows how much profit falls on a dollar invested in the company's own funds.
  M3 - Cost-Effectiveness of permanent capital (Return on permanent capital) - Shows how much profit falls on a dollar taken from sustainable sources of funding.
  M4 - Return on non-current assets - Shows how much profit falls on a dollar of immobile ("frozen") assets. It is an important indicator for industrial enterprises.
  M5 - Return on current assets - Shows how much profit falls on a dollar of means in production. It is an important figure in the first place for retailers.
  M6 - Cost-Effectiveness of debt (Return on debt capital) - Shows how much profit falls on each dollar of debt.
  M7 - Profitability of total capital - Shows how much profit is accounted for each dollar invested into the company.
  M8 - net profit margin - Shows the percentage of net income available in the revenue structure.
  M9 - Accounting return on ordinary activities (EBIT Margin) - Displays the percentage of profit before tax in the revenue structure.
  M10 - Economic profitability ratio (Economical return) - Indicates how many free of cost gross profit is accounted for 1 USD invested in venture.
  T1 - General asset turnover (Total assets turnover) - Indicates the rate of turnover of the company's capital.
  T2 - Turnover of mobile assets - Indicates the rate of turnover of all mobile assets. It is an important figure in the first place for retailers.
  T3 - The turnover of material resources - Indicates the rate of turnover of inventory. It is an important indicator for the industrial enterprises of all types.
  T4 - Turnover of finished goods - Indicates the rate of turnover of finished goods at the company. It is an important indicator for the industrial enterprises of all types.
  T5 - Accounts receivable turnover - Indicates the rate of turnover of accounts receivable in the enterprise. It is an important indicator to identify problems with the sale of the company.
  T6 - Accounts payable turnover - Indicates the rate of turnover of accounts payable at the company. It is an important indicator to identify problems with liquidity in the company.
  T7 - Turnover of non-current assets - Shows the rate of turnover of non-current ("frozen") assets in the enterprise. It is an important indicator for industrial enterprises.
  T8 - Turnover of fixed assets - Shows the turnover rate of fixed assets of the enterprise. It is an important indicator for the industrial enterprises of all types.
  T9 - Turnover of equity - Indicates the rate of turnover of the company equity. It is an important indicator for the industrial enterprises of all types.
  A1 - Medium term of accounts receivable turnover - shows the average maturity of the receivables.
  A2 - Medium term of payables turnover - shows the average maturity of payables.
  A3 - Medium term of assets turnover - shows the average turnover period of the entire enterprise"s assets.
  A4 - Medium term of turnover of mobile assets - Displays the average time of turnover of current assets in the enterprise.
  A5 - Medium term of turnover of finished goods - Shows the average time of turnover of finished products in the enterprise.
  A6 - Average turnover time of fixed assets - shows the average turnover period of non-current (primary production) assets of the enterprise. It is an important indicator for industrial enterprises.
  A7 - Average turnover time of fixed assets - Shows the average time of turnover for plant and equipment in the enterprise. It is an important indicator for industrial enterprises.
  A8 - Medium term turnover of equity - Indicates the average time of turnover on equity of the enterprise.
  Ratios Y were the most important ratios in Russia from 1926 till 2003.
  Y1 - Capital productivity (Yield on capital investments) - Shows the profitability of related-to-production fixed assets of the enterprise.
  Y2 - Capital ratio (Capital investments capacity) - Indicates how many dollars of fixed assets should be invested to produce 1 dollar of Profits at the enterprise. The indicator may be translated into percentages.
  For example, if our company - is a small printing press, the main production capacity - is a 5 machines worth USD 10 000. Let the profit will be $ 1000 for printing over the year. Then, the rate CIC will be $ 10: (10000/1000). That is, there the figure means that the production of $1 of profits has consumed $10 of fixed assets of the enterprise for a year! Or, it means $10 are needed to produce $1 of profit during the whole year, in this case.
  Y3 - Yield on inventories - Indicator of the risk of "hoarding" and of enterprise performance; it shows how much reserves are in this-period-indicator of profit before tax!
  Suppose a company has brought $ 100 of profit. Reserves on the balance are listed at 1,000 dollars. Then YI is 10% (100/1000), that is, there much more stocks than the brought by company profit! There are 2 main options: The high cost of production or crisis of overstocking (problems with the sales!).
  Y4 - Yield on cost price - Indicator of cost structure, look at the dynamics, shows how many cents of profit before tax are accounted for a dollar of production costs.
  S1 - Sustainable economic growth - describes the activity of the joint-stock companies (JSC) with a quoted market shares. It also characterizes the rate of increase in equity from companies" own activities and not at the expense of equity increase by means of extra-emissions (JSC have only two ways to replenish the capital - an additional issue of shares and invest their own net income - this ratio shows the company's growth due to net income, and not by equity issues).
  S2 - Earnings per share - shows how much net income is accounted for a share of common stock. If the ratio is less than 0 - there is a loss, that is, the net profit to cover the ordinary shares is missing to some extent!
  S3 - Dividends per share - shows the amount of dividends per share of common stock. Other designation of this ratio - is Dividend Yield (DY).
  S4 - The coverage ratio of dividends - Indicates whether there is an opportunity for companies to pay dividends on common shares from the profits. Actually it shows how many times a company can repay its dividend from retained earnings for the period. Other designation of this ratio - is Dividend Payout (DP).
  S5 - Total asset value per share - shows what share of assets is owned by the holder of one ordinary share.
  S6 - Value stock price and profits (Price to earnings) - shows the value for a stock and profit from a stock in the company.
  Now, by calculating the coefficients, it would be good to compare them with industry averages and the average values in the industry in the region! This will be discussed in more detail in publications on the preparation of the A-Matrix!
  Also, all the factors you need to look at the dynamics!
  This is an end, not for all factors, and these are particularly important things that you need to know. There more than 3,000 relevant to these coefficients. And the ratios represented here - are the most important financial ratios.
  If you now compare again yourself with a surgeon, now you know how to use perfectly not just a saw, and also all other financial instruments! Now you are able to comprehensively assess the financial condition of any company!
  Well, I"ve done this part of the study that reviews the general theoretical problems of financial analysis of companies in the market. If you're reading this - then you are able to master the tools of broad financial analysis of the company. How do you, dear reader, have already seen, the basis of financial analysis lies in its complexity. It is impossible to analyze just by using one method. To determine the degree of financial stability in the market - it is necessary to use the full range of tools. And now we, dear reader, shall consider one more tool of complex financial analysis: an assessment of the probability of bankruptcy (it will be in the further publications).


  FOOTNOTES in the text:
   The linear model suggests that the interdependence is straight and direct; its graphical representation is a line. An example of a linear model can serve as a transformation of the ruble against the dollar, for example, at the rate of 31 rubles per dollar. Then $ 1 is worth 31 rubles, $ 2 worth 62 rubles, and so on. If we do transfer this model to the graph, we obtain a straight line, because of this fact the models of this type are called linear in mathematics.
   I invite you, dear reader, take a few minutes of attention to the essence of the term discriminant, because you will not once come across this phenomenon in the framework of this paper and in life. The basis of the discriminant concept is the notion of discrimination. I think you know what it is. There are many examples of discrimination: sex, for material wealth, age, educational level, the popularity and fame, and so on. Discrimination - is when something is placed above another of the same rank. Examples of discrimination include the following. For example, a person aged 30 has more rights than in the age of 3 years; or when a person has a specialty, for example, an electrician, he or she has more legal rights to do as an electrician job; or when a financially unstable company has significantly less chances to obtain credit in bank than a financially stable company, and so on. Every person subconsciously discriminated the whole world for himself or herself. Sigmund Freud told much about it in his time: that is, for example, a person for himself or herself is far more interesting and important than, for example, some other object of the surrounding world, or , say, a flower, or some flowers for a person can be more important than others, or the flowers on a certain date are more important than the others, and so on. A person in the process of growing up and education preserves a lot of discriminant frames, tables, coordinates, views, and so on. For financial analysis, we need a figure, as far as single factors or figures for us are more important than other factors and figures, and, it is better when we have an exact figure.
  For more visual perception of the concept of the discriminant in finance, let's look at an example. Let today for us $ 1 means 31 times more than 1 ruble. Then the discriminant index of the ruble is equal to 1 / 31, or 0.0322, or 3.22%. In other words, the importance of a ruble is then 3.22% on the importance of a dollar.
   This indicator can be a relative value, for example, taken from revenue or total assets, as well as some relative ratio, such as liquidity or debt levels.
   Data on shareholders' funds and net profit on the share of other market participants and the market as a whole are taken approximately by use of approximation method based on the data on the percentage of revenue of other companies in this market.
   Data on shareholders' funds and net profit on the share of other market participants and the market as a whole are taken approximately by use of approximation method based on the data on the percentage of revenue of other companies in this market.
   In general, if we consider all models of business-systems' rapid diagnostics, then they can all be reduced to two basic types of models: coefficiental models and models of ideal firms (idealistic approach). => Coefficiental models suggest conducting rapid diagnosis by calculating the recommended critical ratios, the relative performance of the organization activity; these indicators are capable to shed a light on the true state of affairs in the company. Model of an ideal business system put forward criteria for a certain ideal company for a certain sphere of activity, and then it looks: fit or not fit the firm under this model. First, we consider several rapid diagnosis coefficiental models, and then move on to the model of an ideal firm.
   Venture project - it's risky project to introduce a new unknown market technology in the production or manufacture of a new yet unknown market products, goods, works or services; or sometimes it is considered as entering a new market, where such goods have never been seen before.... No one in this case can accurately predict the effect of such a project in the future for you, however, such projects, happen, end with excess profits....
  ** Please, get an acquaintance with the names of different indicators, Dear Reader, because you will meet them further in this book. NP - this is Net Profit, a sums of incomes minus the sum of all the company's expenses, including tax expenses, for a certain period - it is also the grand total of The profit and loss account /in Russian accountings it is line code 190 of #2 'OCUD' (Overall Classifier of Universal accounting Documentation) form/.
  Dear Reader, Please, also note, that as an example the codes of the Russian Financial reporting are used.
  Notwithstanding to more and more wide IFRS usage from 2009-2011 by the Russian companies, their specifics is mostly so the IFRS Financial Reporting is formed from Classical Russian financial reporting standards (the so called 'RSBU' - Russian Standards of Bookkeeping Universal rules) plus subjective experts' judgments on the state of company and, also often, on the practical implementation of the IFRS itself. Usually in the textbooks the wrong translations of IFRS, IAS and ISA are to be performed, plus to all the long ago outdated data can be used to teach the new IFRS-accountants. So, we need to keep that fact, that an analyst can't just use IFRS-reporting without analyzing the RSBU financial statements, that are to be performed based on existing documentation. Plus to all, there is a problem of discrepancies among the data of financial statements performed for tax bodies and other 'external audience', the internal management accountings and the statement of cases in fact inside a company - this is a Russian context that is needed to be taken into an account. OC(Eq) - this is an Owned Capital (Equity) - a total amount of all the owned funds of a company /in Russian accountings - this is the grand total of III-part of Balance Sheet, it is line code 490 of #1 OCUD form/.
  Rev - Revenue - this is a sum of all the receipts and proceeds, a sum of all the money collected by company for a certain period of time /this is the first line of The profit and loss account (statement) , line code 010, form code: #2 OCUD/.
  rROE - is return on equity indicator, this is an owned capital's profitability indicator, which shows the share of net profit compared to the 100% of equity value. This ratio indicates how many cents of net profit are received in a certain period for each 1 dollar invested as the owned capital of a company.
  A - Assets - this is a sum of total assets, this is complete balance sheet value of a company /line code 300, which is equal to line code 700, form code: #1 OCUD/.
   C1 - is a measure of return on equity, net profit share in the cost of capital. This ratio indicates how many cents of net profit a company was able to earn in a pure form from each 1 dollar invested in company's equity.
   C2 - is a measure of the profitability of sales, which indicates how many cents of net income we see in 1 dollar of company's revenue during the same period.
   C3 - is a measure of asset turnover, which shows two things. 1 - it shows how many cents of revenue is accounted for 1 dollar of assets. 2 - it also shows: on how many % the assets of the company were involved in, and how many % of them were "dirty" paid off during the reporting period. Thus, this indicator of 33% means that the capital of the company turns over the three such-like periods (100% / 33% = 3).
   C4 - is a measure of financial leverage, which indicates how many cents of additional loan funds is accounted for 1 ruble of owned funds in a company.
   C5 - is a measure that indicates how many cents of total receivables (long- and short- term) is for each 1 dollar of company's book value.
  AR - Accounts Receivables - it displays the amount of money that third parties should pay to a company for a certain period. The index is the sum of long-term AR / 230 code form number 1 OKUD (Balance Sheet) / and of short-term AR / 240 code form number 1 OKUD /. The long-term AR - is more than a year, respectively, short-term - is less than a year.
   The ratios characterize the little-risky state of the individual components of the financial, operational and marketing, investment cycles. If a factor does not correspond to that described in the schema, then an attention should be paid to this risky component in the functioning of a certain firm.
   NP - it's net profit, the amount of income after deducting all expenses of the company, including the payment of taxes - it is also a grand total of the Profit and Loss Statement / line code 190 / (number 2 OKUD Form). Rev - Revenue - it's the total of all money received by the company during the reporting period, without taking costs into an account - this is the first line of code 2 OKUD form / line 010 / (Income statement).
  MobA - Current Assets (Mobile Assets) - these are the amounts available of the company's property holdings, including securities (including money), the time of turnover for which is not more than 1 reporting period (year), as well as the amount of long-term accounts receivable / line code 290 number 1 OKUD form (Balance Sheet) /. Inv - these are inventories - this is the amount of the carrying value of inventory, which are intended for use in production and (or) the subsequent sale to generate income / line code 210form number 1 OKUD /. =>
  STL - this is the sum of short-term borrowings (liabilities) - these are liabilities to maturity, which should be fulfilled within 1 reporting period (1 year) by company since the date of the balance sheet cut-off performance / code line 690 form number 1 OKUD /. LTL - is the sum of long-term debt (liabilities) - this is a debt to repay, which must be fulfilled for a period more than 1 reporting period (1 year) by company since the date of the balance sheet cut-off performance / code line 590 form number 1 OKUD /. MF (PPE) - is the sum of book value of main funds (property, plant and equipment or fixed assets) - these are buildings, facilities, equipment and production lines, which transfer their value to the products of partial reimbursement of the cost by method of depreciation-amortization during the period of more than 1 reporting period (more than 1 year) since the balance sheet cut-off performance / code line 120 form number 1 OKUD /. n - the number of periods of long-term debt repayment. It should be taken in average over the whole period of calculation of LTL. Method: multiply what you need to pay for these funds in one year on the average number of years. You, dear reader, should do this for all lines of all elements of LTL. Then, all is to be calculated with taking into an account the total number of years, the impact of these funds for all LTL by the average-arithmetic-weighted. In order to better visualize the technique of calculation, let's consider an example. Suppose there is a credit to the repayment in 7.000 USD for 2 years and another credit for 10.000 USD for 3 years in total. Then the average repayment period will be: (7,000 * 2 +10,000 * 3) / (7,000 +10,000) = 44,000/17,000 = = 2.588 years. PPEac - this is the acquisition of PPE over the reporting period, expressed at their fair value or at book value.
  PPEdis - it's disposal of PPE denominated in the same manner, how you choose to take into account the acquisition of PPE: the fair, or the book value. PPEper beg - it is the sum of PPE at the beginning of the period, calculated as on your chosen method of the above. PPE - it is the main funds or fixed assets (Property, Plant and Equipment). HRarr - Receipt/arrival of staff. Shows how many people came to work in your company during the analyzed period. HR(DoM) - this attrition (Human Resources Discontinuation of Membership). Shows how many people went from your company during the analyzed period. HRbeg - it is the average number of staff at the beginning of the period in which you conduct the analysis.
   HR formula [Alexander Shemetev] - The conditional average number of workers in your organization during the study period. It is the sum of the average number of staff at the beginning of the study period (HRbeg) and at the end of the period (HRend) divided by two (followed by two slice during the study period).
   Operational (production) and the most important for the generation of profits - marketing
   XYZ-axis - it shows the marketing-statistical characteristics of sold by company products (goods, works and services). X - means that the average probability of error in calculating the probability of sale of goods is not more than 10-15%. Y means that the same probability is 15 to 30%. Z means that the same probability of error in the calculation is of more than 30%.
   ABC-axis - it shows the marketing-and-consumer properties of certain company's goods, where Group A - are the goods for which demand has the maximum value, Group B - are goods for which demand is not very high, not very stable and usually falls, Group C - is leaving or almost gone from the market products.
   Owned funds - this is equity of organization, which includes indicators: Share capital, additional capital, purpose receipts and earmarked reserves, retained earnings from previous years; Σ S / term liabilities - this is the sum of short-term obligations, which include accounts payable and other current liabilities. Receipt of short-term liabilities is related to income of liquid funds, and retirement - is related to retirement. => Long-term liabilities (Σ L / term liabilities) are estimated similarly; Σ L / term assets - this is the sum of long-lived assets, which include: intangible assets, fixed assets, pending capital investments, long-term investments, other non-current assets. Admission of Σ L / term assets corresponds with the disposal of liquid funds, the disposal of Σ L / term assets corresponds with the admission of the liquid funds. Retained earnings - corresponds to the retained earnings of the current period - its entrance to the organization at this period - it corresponds with the increase of liquid funds inside the organization. Liabilities (STL (short-term debt) and LTL (long-term liabilities (long-term debt))).This line shows the general trend in commitments: increase in commitments is related with the income of liquid funds, the extinction of obligations is related with the outflow of liquid funds.
   Property (PPE+other) - it corresponds with the acquisition of property by an enterprise - mainly these are PPE (fixed assets), and, together with this, this line corresponds with the non-current and current assets (which are related to the property). Purchase of property (buildings, structures, inventories, ... ..) comes due to the decline of liquid funds, and the disposal of the property - it corresponds with the income of liquid funds.
   For this example all the coefficients are numbered: 1,2,3 - indicators of the financial cycle, the short, medium and long-term priorities, respectively; 4,5,6 - indicators of operational and marketing cycles, short, medium and long-term priorities, respectively; 7,8,9 - indicators of the investment cycle, the short, medium and long-term priorities, respectively.
   Sign "X" on top of matrices means that these elements are multiplied together. "+" Sign - the results of calculations of the upper matrix sum with each other. The sign "-" - the results of calculation of the lower matrices are then subtracted. It turns out in a number of matrix determinant.
   The first matrix: multiply figures 1 * 5 * 9. The second matrix: multiply figures 2 * 6 * 7. The third matrix: figures are multiplied 3 * 4 * 8. The results are summed.
   The fourth matrix: multiply indices: 7 * 5 * 3. The fifth matrix: multiply items: 1 * 6 * 8. Sixth matrix: the elements are multiplied together: 2 * 4 * 9. The results obtained are subtracted from the calculation results of the first three matrices at the top of the circuit.
   It should be noted that you can quickly calculate the determinant of the matrix without any formulas, just by writing down the matrix, for instance, in Excel spreadsheets and gain function MDETERM (), where in brackets it should be indicated with the mouse the whole matrix by selecting it from top to bottom. In Russian Excel this function is: МОПРЕД ().
   ABC - is a notation for the coefficients of the financial cycle short, medium and long-term priorities, respectively; DEF - is a notation for the coefficients of the operational and marketing cycle short, medium and long-term priorities, respectively; XYZ - is a notation for the coefficients of the investment cycle short, medium and long-term priorities, respectively.
   ** 21 - is the sum of: (6 +5 +4 +3 +2 +1) = 21. C (of reserve) - is a ratio of reserve. A, B, C, D, E, F - these are coefficients: ABC - is a notation for the coefficients of the financial cycle short, medium and long-term priorities, respectively; DEF - is a notation for the coefficients of the operational and marketing cycle short, medium and long-term priorities, respectively.
   ** TIME - this is time, which has a company to implement the anti-crisis measures before the potential precipice of financial, operational and marketing cycles, in case of crisis trends in the external environment (if the market situation and the economy does not improve significantly itself), expressed in the same reporting periods in which the calculation was made, for example, in years.
   TL - Total Liabilities; OC(Eq) - Owned Capital (Equity); NP - Net Profit; Rev - Revenue; STL - Short-Term Liabilities; LTL - Long-Term Liabilities; Inv - Inventories; MobA - Mobile Assets (current assets).
   Insider - associated with insiders. Insider (Insider - 'Spy' - is embedded into the management body of other company person, whose purpose is to collect data and sabotage) - there is no such term in Russian, at the same time, such methods persist in Russia...
   You, dear reader, are probably asking me now: 'What are the else reasons for anomaly distribution of risk?'. This is a very good question. If you are holding this question in your head, you've carefully read my paper. I am very pleased by your attention - thank you for it. Anomalies in the distribution of risk that cause the matrix off-scale may occur for several reasons. The company itself bankrupt with huge financial problems .... Firm just at the moment "windfall" a successful deal, and the rest of the time it is different from the current activity. Or it is simply an abandoned business, which accounts for some hanging out sum of money. That's how much you can learn about the company, using the proposed by the Alexander Shemetev model of proximate analysis. Learn more about what is happening in the company, you can, for example, by inquiry about its work at the moment.
   Not all the banks are living due to credit activity, and in some countries banks' lending is banned altogether, at the same time, the essence of the bank preserves itself. Investment remains as the essence of activity: Bank is looking for investors (depositors, shareholders, ....) and place their funds with a return for bank and for others.
   Contractual strategy - suggests that sales of products are made due to mainly several of the same product buyers, who dictate their terms to the company in separate agreements, supply contracts under certain conditions.
   Scoring - is the process of charging or writing off the scores ('points', 'items') - this score is added or subtracted from the company if its divergence from the ideal state for a certain criterion.
   ImmA - is an indicator of long-lived assets (Immobile assets or non-current assets) - it represents the asset maturity over 1 year, transferring its value gradually to some products by means of depreciation. MobA - these are already very familiar Current Assets (Mobile Assets); OC(Eq) - Owned Capital (equity); TL - total liabilities (total debt capital); STL - Short-Term Liabilities; R(CL) - Ratio of Current Liquidity (let's speak about it further) - it must have a value not less than 1 and not greater than 2.5; C(OFS) - Coefficient of Owned Funds Sufficiency (let's speak about it also further).
   RF - Russian Federation (Russia). There were taken official materials of the Finance Academy under the RF Government.
   Assets are aggregated for the next groups:
   A1 - are the most liquid assets that can be immediately used to pay liabilities. These include cash and short-term investments (lines 250 and 260 of Russian balance);
   A2 - are the quick-assets that can be used for payments to creditors within 30 days and accounts receivable to 1 years, which could potentially be resold if necessary (accounted for in full). This includes lines 240 and 270 of the Russian balance sheet.
   A3 - are the slowly sold assets. These include receivables with a maturity of more than '1, stock except for prepayments, VAT on purchased goods and long-term investments: lines 210-216, lines 220, 230, 140 in the Russian balance.
   A4 - these are illiquid assets - all non-current assets (total of first section of the balance), net from long-term investments (Line 140 in the Russian balance).
   P1 - these are the most urgent liabilities - accounts payable, payable to the founders and members, and loans which are not repaid on time (according to the application to balance): lines 620, 630, 670 in the Russian balance.
   P2 - these are the short-term liabilities: loans for the period of execution of up to 12 months (610 line in the Russian balance).
   P3 - these are the long-term liabilities - all the long-term liabilities net of deferred expenses (line 216 in the Russian balance) - it is the sum of lines 590, 640, 650, 660 minus 216 line in the Russian balance.
   P4 - these are permanent liabilities - this is the result of 3rd part of the balance: 'Capital and reserves'.
   TAS - it is the result of the balance sheet (Total Assets' Sum).
   This refers to different variations of Wait-if-analysis; Waiting analysis ('Analysis: What if ..." - Amer.) - is the forecasting of firm development based on the simulation of different variables of the environment. Wait-if analysis, unlike the stress tests, involves simply modeling the situation in the selected variable component, which is not always the most likely scenario of development, while the stress-testing assesses the most probable state of variables in different situations.
   Balance Sheet (Form number 1 on OKUD) consists of 5 sections (I, II sections - is an asset; III, IV, V sections - is a passive). The most basic lines are marked in each section of the scheme. The Russian balance sheet codes are presented in the parentheses after the basic components of the balance (for example, (210) means the line code 210 of Balance Sheet (Form number 1 on OKUD): "Inventories"). The designations are as follows. IA - it's intangible assets - these are non-material (intangible) assets used in the production, which have an assessable value in monetary terms. FA - these are fixed assets - buildings, equipment, etc., that are used in the production process. IC - is incomplete construction - it's construction in process. LTFI - these are the long-term financial investments - these are non-current assets which were acquired as investment funds for investment income in the long run, including the investments into the associated companies. Inv - these are inventories: material assets, including raw materials, work in progress and finished products, as well as some other elements. AR - this is accounts receivable - it is the amount of resources that third parties owe to the organization. AP - these are accounts payable - it is the amount of resources that company itself owe to the third parties. MF - these are monetary funds available inside the company. STFI - these are short-term financial investments. AC - it's authorized capital - these are shares made by holders under the terms of the creation of the organization. OC, RC - these are odd capital and reserve capital - these are level 1 capital funds that extend the capital of organization. RE - these are retained earnings from previous reporting periods. C&B - these are company's credits and borrowings (loans).
   Model of average weighted cost of capital (WACC - Weighted Average Cost of Capital, Amer.) - It is a common model to estimate the actual price at which the company conducts its normal financial activities.
   Public corporation of a closed form - this is a public company whose shares are not traded at the market.
   Where: d OC(Eq) - This is the share of owned capital (equity) of an enterprise = OC(Eq)/TAS (TAS - this is the total assets' sum, which is equal to the company passives sum and company's book value); r OC(Eq) - The cost of using an owned equity by a company (as a minimum, this is the norm rate of return on investments); d TL - Share of Debt Capital = TL/TAS (TL - Total Liabilities); k% - This is the average percentage of the cost of attracting of borrowed capital to company; Т - Tax rate.
   Where: d TL - Proportion of debt capital; k% - this is the average percentage of the cost of borrowing of the organization's Capital; T - The tax rate; dP - Share of equity (preferred shares and corporate bonds); rP - Price to attract equity capital (preferred shares and corporate bonds); dS - Share of equity (ordinary shares); rS - Price to attract equity (ordinary shares).
   The specified method divides the cash flows on loans for uniformed flows, regardless of whether they are established uniformed in fact, understanding that ultimately it aligns with the calculation of the exact result.
   Where: i1, i2, ..., in - General rates (including bank and other fees) under the loan agreements on the providing the debt capital for company in any form; Σ - is an icon, which means 'sum'; V1, V2, ..., Vn - from English 'Volume' - The volume of loans received by the company on credit agreements ? 1, ? 2, ..., ? n.
   Where: i1, i2, ..., in - General rates (including bank and other fees) under the loan agreements on the providing the debt capital for company in any form; Σ - is an icon, which means 'sum'; V1, V2, ..., Vn - from English 'Volume' - The volume of loans received by the company on credit agreements ? 1, ? 2, ..., ? n; t1, t2, ..., tn - total time-terms of each loan from the beginning to the end of the credit period, expressed in years.
   It should be noted that the value of the formula does not change depending on what unit of measurement we use in the calculation: USD, thousand $ (th.USD), million USD and so on. For example, 1000/100 = 100/10 = 10 / 1 = 10. The main thing is that everywhere in the formula there should be used the same unit of measurement.
   Where: a - is an annual one-time payment, which company will make in order of repayment of loans. This sum includes interests. q - is the 'step' of geometric progression, which, in case of borrowing, is equal to (1+i), where i - is the interest rate. n - is the total number of these 'steps', which, in case of borrowing, is equal to the number of debt repayment periods.
   C - is a fixed equal every-period-occurring-payment on borrowed funds. n - term of loan in such periods (eg, in years).
   Russian Federation Civil Code involves a fair interest on the loan. For example, if declared, that the cost of credit is 26%, and at the end of the first year under any scheme of interest there must be paid, for example, 32%, it is an unjustified enrichment, and it should be reimbursed in full volume, including the possible damages. That is why there is a possibility for banks and other borrowers to hide interest rates in credits themselves on the basis of annuities, that is, each-period-occurring equal installments. Thus, the model accurately estimates the expected credit interest rate at market interest rate for borrowed funds.
   FV - Future Value ('The future value', Amer.) - It is the sum of all payments on loans during the lending process.
   PV - Present Value ('The present value', Amer.) - the today's cost of debt which is equal to the originally given to the company loan amount.
   Leverage (English Leverage - 'Arm' for carrying cargoes). Financial leverage - it is a theory of financial management, according to which a company uses borrowed money to be more successful, at the same time, it makes the return on equity higher. This is true for overseas.... In Russia, where the interest rates are so much high, financial leverage works negatively....
   Symbols in the table: YB - data at beginning of year. YE - data at end of year. A - is the dynamics of the absolute values (line 3 - line 2). B - is the dynamics of specific gravity (line 5 - line 4). C - is the dynamics of % increments to the values at the beginning of the year (line 6: line 2) x100%. D - the dynamics of growth structure in the balance sheet total value (line 6: Total assets) x 100%. AB - are absolute (numeric or cash (in thousands or millions rubles/USD)) Values. SG - Specific Gravity - it is the index of balance sheet items, expressed in % of total sum. Code - a string code in Russian balance. Approximate numbers (#) of accounts for audit - this is the approximate number of accounts that make up these lines - they are given for internal audit. If this is 01 - it's the same thing as 01 account "Fixed Assets", and so on. A more detailed account name can be found in the Chart of Accounts, and their composition - in the regulations, especially in the PBU (Russian: Provisions of Book-keeping Universal rules). It should be noted that some individual accounts at firms' accounting may differ from those given in the table, depending on the applied accounting policies inside the company.
   The main criterion for the recognition from January 1, 2011 is: an object of property should serve as a material property object to a company, put on a record in accounting; the value of this object should exceed 40 thousand rubles (circa 1,300 USD) and it should have a useful life of more than '1.
   This is the classical definition. Financial stability - is a characteristic of the legal entity, which indicates a stable excess of revenue over expenditure, free cash maneuvering in the company, their effective use in productive activities.
   Under the solvency it is understood the ability of a potential debtor to pay all the resulting liabilities to creditors, to the authorized bodies (Federal tax service, customs office and so on) and to other third parties, - to the creditors who have right to claim a portion in cash and cash equivalents from the company-debtor in terms and conditions stated in contractual obligations of firm and in applicable law regulations.
   Credibility (creditworthiness) requires, in general, a positive credit history of an economic entity, which is outwardly manifested in the ability to obtain credit and retribution (to tribute or pay) on them in accordance with the contractual terms and current legislation in terms of maturity, interest payment and repayment.
   Where for these formulas: ImmA - Immobile Assets; OC(Eq) - Owned Capital (Equity); Inv - Inventories; STL - Short-Term Liabilities; LTL - Long-Term Liabilities.
   Where: d OC(Eq) - This is the share of owned capital (equity) of an enterprise = OC(Eq)/TAS (TAS - this is the total assets' sum, which is equal to the company passives sum and company's book value); r OC(Eq) - The cost of using an owned equity by a company (as a minimum, this is the norm rate of return on investments); d TL - Share of Debt Capital = TL/TAS (TL - Total Liabilities); k% - This is the average percentage of the cost of attracting of borrowed capital to company; Т - Tax rate. Where: d TL - Proportion of debt capital; k% - this is the average percentage of the cost of borrowing of the organization's Capital; T - The tax rate; dP - Share of equity (preferred shares and corporate bonds); rP - Price to attract equity capital (preferred shares and corporate bonds); dS - Share of equity (ordinary shares); rS - Price to attract equity (ordinary shares). It is isolated in a separate formula, as a component of the formula calculation method - the share of borrowed capital - is significantly different from similar techniques, for example, for Co Ltd., because the OC(Eq) in the public companies is made up of stocks and securities of various kinds. It should be noted that corporate bonds and the cost of capital should be treated as preferred stock to simplify the calculation, as it is already described above.
   Sometimes, in the financial literature, the return on sales is defined as revenue (Rev), divided by cost. However, logically, the figures, in which revenue is shown in the numerator - they show not the profitability (which is associated with the effect on the type of property) - they show turnover, in this case, of cost (Cost). For example, value of the index Rev/Cost in 1.09 means that the expenditures, accumulated in costs, are over-covered by the revenue in 1.09 times for the same reporting period - this is an indicator of their turnover. The logical mean of turnover (revenue) is to reveal what is the business-activity of company, to reveal the sum such company may operate in its functional turnover. The abbreviations in the formulas are as follows: PBT - Profit Before Taxes - this is the profit before taxes after the interest payments; in domestic accounting it can be counted just as profit before tax (as a string 140 of the profit and loss statement). Rev - is already familiar to you, dear reader, the sum of revenue - the amount of means received during the reporting period. Mpr - is the profit margin indicator.
   Mtps - is the return on total capital. TPS - is the book value of passives /total passives sum/ (total balance, line 700, mathematically, and not logically, it is equal to the line 300 balance (total assets sum)).
   Net profit margin - is the company functioning efficiency, expressed through the prism of net profit. Thou shall not be confused to separate the net profit and the retained profit, especially in the public companies.
   The notations in the following formulas are next: Crdinv - Coefficient of relative density of inventories; Inv - is the sum of inventories; TBS - total balance sheet sum, equal to both TAS and TPS; Crdrm - is a measure of raw materials and other similar values; RM - raw materials and other similar values; Crdfg - is the index of finished goods; FG - finished goods; NP - net profit.
   Blitz-value of the firm - is the cost in terms of the generated by company positive cash flows from ordinary activities that are converted to the company's value by the price of capital. The denotations in the formulas are as follows: ReP - is the reporting period, expressed in days (if the slice is taken once a year - it is equal to 365 days). AP - is Accounts Payable. AR - is Accounts Receivable.
   The following notations are used in this formula. CNA - is net asset value (cost). TBS (A) - is a book value of assets, which is equal to the total balance. Liabilities (TL) - is all the obligations (sum of borrowed capital).
   P% - is the average market rate for loans to industry. It can be calculated as the arithmetic mean of the individual loan products average interest rates to companies in the industry (the average market price of accounts payable; of long-term loans from third-party entities; of long-term credit products from banking institutions and so on).
   C% - is the average implicit interest for a limited number of typical loan contracts on selected study, calculated by determining the exact percentage.
   H% - is the declared market price of credit resources for a limited number of typical loan contracts that are selected for the study.
   My dear reader, please, do not entangle the depreciation of assets and the depreciation of capital (passives' part) between each other.
   The theory of "bet-index" (1982) suggests the combination of trading on the exchange with the "entertainment": operations on futures and other securities are provided not through an intermediary broker, and through a bookmaker, - then the profit is equal to the winning in gambling-and-similar-games-of-chance, and so the profit is outside the taxation scope (isn't taxed), which increases the effect of the operation.
   Line 070 - it's interest expense in the profit and loss statement; line 510 (Long-term loans and credits) and 520 (Other Long-term borrowings / they reflect possible errors in the accounting and other means of reflection /) - they reflect the borrowed funds, which are the primary basis for the implicit interests calculation. Lines 610 (short-term loans), and line 660 (other short-term borrowings) show the additional funds which may accrue. Please note that we do not consider the rate payable as a basis for the accrual of interest, because normally it should be overlapped by accounts receivables. In addition, Russia has adopted a practice rarely to pay interests on accounts payable (workers usually do not require% from salary arrears; tax and other state bodies and authorities may charge means at no more than CBRF refinancing rate; the suppliers and contractors who 'resort' to accounts payable, generally, they tend to raise their own trade turnover, that is why they are interested to sell their products by any means, that is why they rarely use interests-accruing, - even when they use the interests in their agreements - these interests should be covered by the accounts receivable both on debt-body base and interest-base.
   Denotations to the scheme. IA - Intagible Assets - these are Non-Material Assets (NMA); FA - Fixed Assets or PPE - Property, Plant and Equipment; CapI - Capital Investments - this is familiar to you, my dear reader, from the earlier text incomplete construction - it's construction in process; LTFI - Long-Term Financial Investments; Inv - Inventories; AR - Accounts Receivable; STFI - Short-Term Financial Investment; MF - Monetary Funds; RE - Retained Earnings; AP - Accounts Payable; STL - Short-Term Liabilities(borrowed capital); LTL - Long-Term Liabilities (borrowed capital); AC - Authorized Capital; OC - Odd Capital; Reser - this is the sum of reserve capital and also formed by a company reserves for future expenses, for possible losses and other reserves (this includes lines 640 and 650 liability balance, along with reserve capital). A - total assets sum (TAS); P - total passives sum (TPS) = STL+LTL+OC(Eq).
   OC(Eq) - Owned capital (equity) (line: 490); TL - Total Liabilities (total value of IV and V part of balance (line: 590 + line: 690)); ImmA - Immobile Assets (line: 190); MobA - Mobile Assets (line: 290); Inv - Inventories (line: 210); LTL - Long-Term-Liabilities line: 590); FA - Fixed Assets (line: 120); RM - Raw Materials (line: 211); TBS - Total Balance sheet Sum (line: 300 or line: 700); STL - Short-Term-Liabilities (line: 690); UFP - Unfinished Production (line: 213); +/- shows that this certain ratio has no fix-stated norm: it is necessary to watch this ratio in dynamics as well as to watch for its meaning.
   Cook Ratio - is a ratio of classifying the capital sufficiency of commercial banks. For common companies' analysis the assets range is interesting as it goes in accordance with the Cook ratio. This assets ranging goes from the stated risks of typical risky and risk-free assets, as well as this ratio states the risk-free-share for every kind of financial asset. It can be used to estimate the risk-free rate for a certain region or to estimate the other financial factors.
   In the Middle Ages and the Renaissance "Inflation' (inflatio) was called as: "money in circulation." However, the discovery of America led to the mass "pumping" of gold from there and transport it to Europe. Gold was so great that it spread throughout Europe, increasing the amount of money in circulation at times. Even in pre-revolutionary Russia, about 92% of the gold domes of churches, icons, frames, and so on - were made of " Indians gold ", which was mainly caught in the Latin America / Russia couldn't find the gold in its territory in large quantities until the middle of the 18th century /. Then the "Money in circulation ' (inflatio) inside the European States did not lead to an equivalent enrichment of these states, as predicted treasurers, and it led to a large rise in prices everywhere ....Economists have tried to explain at the New time and later this phenomenon - the more money has been "poured" into the economy - the more they raise their prices. So, in general science there is introduced the concept of "inflation" - the depreciation of money over time (then gold and silver, as well as the modern equivalents of money). The exact boundaries of runaway inflation do not exist due to differences in economic systems of different countries. As a runaway inflation - it is called a rate above 9.8% and below 50% (sometimes - up to 100%) per annum.
  
  * Line: - this a denotation of the line of Russian balance, including the appendixes to balance. For instance, line: 250 - this is line #250 from the balance sheet forms.
   The names in the brackets are more appropriate for the anti-crisis management, where the sale of assets or extra-payment or partial non-payment on parts of liabilities - is a managerial tool to improve cases inside a company.
  
  Dear reaser, if you want to see this paper in the vectorized format with footnotes inside the text, please, look at the mirrow of this paper represented in vectorized format in the following address:
  http://free.yudu.com/item/details/466033/Alexander-Shemetev-s-models-for-complex-financial-analysis


 Ваша оценка:

Связаться с программистом сайта.

Новые книги авторов СИ, вышедшие из печати:
О.Болдырева "Крадуш. Чужие души" М.Николаев "Вторжение на Землю"

Как попасть в этoт список
Сайт - "Художники" .. || .. Доска об'явлений "Книги"