|
|
||
Abstract: This paper has the most modern methods of bankruptcy forecasting recommended to use in the modern Russian conditions. This paper tells about the achievements of the Great scientists in economy. This paper also discloses some methods created by Alexander Shemetev to forecast bankruptcy: Alexander Shemetev"s method for calculating the optimal portfolio with the set returns which improves Harry Markowitz method for the Russian market; The self-model of Alexander Shemetev for firms" bankruptcy forecasting based on synthesis of 42-years experience of Ghent University. Key words: bankruptcy, analysis, economy, finance, portfolio of shares, Harry Markowitz, William F. Sharpe, John Burr Williams, Stephen Alan Ross, William Henry Beaver, Edward I. Altman, Stuart Altman, John Fulmer, Gordon Springate, Sofie Balcaen, Hubert Ooghe, Eric Verbaere. | ||


 (233)
 (234)
 B A", the world did not stop on them .... There were also some more sophisticated operations such as "M M", who shared major shareholders (M / large packages of shares /) and minority (also M / small stakes shareholders /)... One M-people could manage their companies and companies" property flows ... while the other M-people could manage only their money-flows... As a result, the assets were divided: the major shareholders stayed with company"s assets in the end, while the minority shareholders stayed only with company"s debts in the end.
 (235)
 (235.1)
 (236)
 (237)
 (238)
 (239)
 The debt must be less than 100,000 [7] rubles (circa it is more than 3,000 USD).
For individual entrepreneurs (IE) this amount is reduced to 10,000 rubles.
Penalties, sanctions" sums, arrears of wages and penalties are not included in the principal amount of debt.
There must be three months of overdue of debt.
There must be an entered-into-legal-force court decision on recovery of the debt or a decision of the tax authority or the decision of the customs authority.
Only a legal entity (no individuals) may file for bankruptcy.
 (240)
 (241)
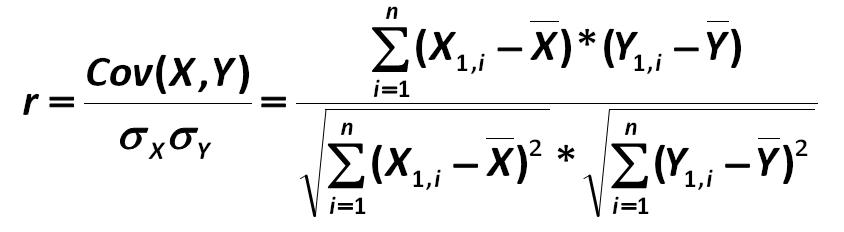
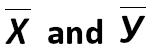 - this is the average value of observed variables X and Y; Cov (X, Y) - is a ratio of covariance, which shows the relationship between two variables;
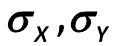 - these are the standard deviations, which show the total amount that the value will be rejected averagely for any measure.
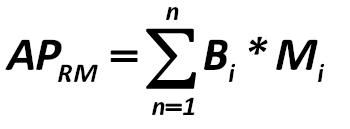 (242)
 ) as a measure of risk inherent in the solution with a probabilistic outcome. standard deviation () - is RMS (root-mean-square) absolute deviation of possible values of a random variable from the expected value.
): variation (classical and weight), information-atomic (classical and weight) and atomic (classical and weight). To simplify the perception of the following material, the author of this paper gives his own interpretation of what shows each approach in the best degree.
 (243)
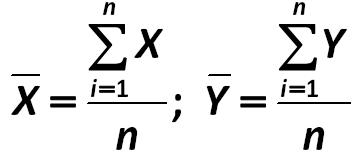
 - the average value of X, calculated by the formula (241); Xi - the value of i-th parameter.

 (244)

 (245)

 (247)
 (248)
 (249)
 (250)
 (251)
 (252)
 (253)
 (254)
 (255)
 .
 (256)
 (257)
 (258)


 (259)
 (260)

 (261)
 - is the expected return on individual stocks; a0 - is a risk-free rate of return on investments; ai - is a risk premium for the i-th factor; ui - is the volatility of the expected return from the i-th risk factor.
 (262)
 (263)


 (264)
 hence, such a portfolio is more optimal than the existing one. Converting an existing portfolio to the best one by the sale of 52% of the portfolio number 2 share, 47.945% of the portfolio number 4 share and the acquisition of an additional 195.2% of the portfolio number 3 share and selling number 1 portfolio will bring to company 0.171205 thousand $ of income. And it should be done immediately, because the theory arbitrageur assumes that the market will soon equalize the fair price for portfolios by aligning them.
 (265)


 ) is given by (261):

 (266)

 (267)

 (269)
 (270)


 (271)
 - It is a profitability or yield of a certain X-th security in the portfolio.

 (272)


 (274)


 (276)
 (277)
 (278)


 (279)
 (280)


 (282)
 (283)
 (284)
 This method allows to calculate the current financial needs accurately, as well as the timing of their occurrence.
In this method, there is a significant disadvantage. The forecast is always based on prior periods for which the trend will always be gotten positive. Otherwise, that is, if the trend was negative, then there would arise a question - why is there such a company which from period to period brings only losses. This would be contrary to the first axiom of financial management, under which all economic agents always behave themselves as Homo Economicus, ie, extremely rational. Differences in rationality are possible only in cases of subjective evaluation of values of probabilities of certain events, as well as in cases of the propensity to take risks, and not to create a non-profit enterprise.
The method shows the bankruptcy risk at crisis enterprises only.
 (284.1)
The ability to combine all the advantages available in the arsenal of different models to predict bankruptcy.
Ability to update the model by introducing a new data on the newly bankrupt companies, and by the newly established techniques, as well as changes in reporting by enterprises for subsequent periods.
Ability of this methodology to the "eternal" existence through the gradual evolution of the methodology and analysis by new incoming data.
An ability to create an output equation/model from the genetic model that could provide an opportunity to use the genetic algorithm "manually".
The extreme complexity of the calculations.
The need for powerful computers for model building.
The high cost of creating the model.
The complexity of information systems" service.

 It is easy to use.
This method is considered as one of the most modern and reliable to date.
The need for a sophisticated computer.
The high cost of programming and keeping up of developers.
An ability of an erroneous calculation by the "black box" algorithm, therefore, the end output values may be distorted by the primary "black box" algorithm.
You can not affect the calculation process.
Failures to correct the data.
It applies mathematical model of calculation of probability parameters.
Comparative ability to use it manually.
Subjective assessment of probabilities. This can lead to distortion of the actual probability of the occurrence of bankruptcy.
The complexity of the calculations.
The probability of a false probabilistic algorithm.
It applies mathematical model of calculation of probability parameters.
The model considers not only internal enterprise accounting"s financial factors, and primarily it considers the enterprise environmental factors, macro and micro.
Subjective choice of system factors. This can lead to distortion of the actual probability of the occurrence of bankruptcy.
The complexity of the calculations.
Implementation of the prognosis of systemic factors is made only on the basis of trend data and probability values of the factors.
 (285)
 (287)
 (288)
 (288.1)
 (289)
 (290)
If a company is already in the area of bankruptcy and is moving into it further and deeper - it can be argued that it would go bankrupt within a year, with high probability.
If a company is in a critical area of bankruptcy procedures listed below, and the rates vary slowly for the better, then there is a high probability of its bankruptcy in the next two years!
If a company is in the normal zone, and is steadily moving in the crisis zone or the zone of the bankrupt, it can be argued that a high probability of its bankruptcy is possible in the next two - three years!
If a company is in crisis ("gray") zone or in the normal zone. And the trend is sharply positive. That is, it distances itself from the zone of the bankrupt. It can be argued that a company is not threatened by Bankruptcy with high probability in the absence of jumps in a change in its capital.
If Belarusian model went "out of its scale", then there is some probability that within the company there is a discrepancy between the accounting and financial accounting, because the model "off-scale" is primarily due to the predominance of multiple revenue over profits (organization all its funds above the limit is required to keep in bank accounts, and it has to reflect them in any case). This can lead to off-scaling.
If some model shows that the company - is a bankrupt, and another models shows this company - is not a bankrupt: we need to break these models into their components and find out what are the factors and ratios that cause the overstating of some model or models. And if this ratio shows a positive trend for the enterprise, it may show this company most probably is safe from bankruptcy. And, when laying out a model for the enterprise revealed some factor or factors gave poor results and showed negative trends, it may lead to company"s bankruptcy!

 Altman technique originally was designed to work only with companies of JSC-form. Even for JSC companies there markets where it is important to estimate the market price of shares, for example, the Russian stock market. The Russian stock market is mostly a path for mergers and acquisitions, rather than a path of market relations. Besides, there are the non-JSC companies. That is why the author of this paper offers to use the sum of the Authorized capital and the additional capital. This technique is motivated as follows: increase in the value of assets leads either to an increase in the authorized capital of an enterprise (this corresponds to an increase of nominal value or additional issue of shares) or to an increase in additional capital (this corresponds to an increase in market value due to increased reliability).


 Current liquidity Ratio L1 (CR) =
 (301)


 (305)
 (308)


 (310)
 (311)
 (312)
 (313)


 (319)
 (320)
 (321)
 (322)
 (323)
 (324)


 (331)
 (332)
 (333)
 (334)


 (342)
 (343)
 (344)
 (345)

 (346)
 (347)

 (348A)
 (349)


 (353)
 (354)

 (356)
 (357)
 (358)
 (359)
 (360)
 (361)
 (362)




 (369)
 (370)
 (371)


 (375)


 (391)


 (394)

 (396)
 (397)

 (399)
 (400)


 (405)


 (414)
 (415)
 (416)
 (417)

 (418)
 (419)
 (420)
 (421)
 (422)
 (423)
 (424)
 (425)
 (426)
 (427)
 (428)

 (429)
 (430)
 (431)
 (432)


 (433)

 (435)
 (436)
 (437)
 (438)
 (439)
 (440)
 (441)


 (444)


 (446)
 (447)
 (448)
 (449)
 (450)


 ! Assessment of the dynamics of the balance by year: Seeing the positive and negative trends!
NWC = Current A - Current P = MobA - STL (If the MobA = NWC, then this enterprise has no shortage on its own resources), MobA>NWC, it has a shortage of funds. There is a need to manage the AP (Accounts Payable). MobA Current A Turnover = Revenue/Current A. The more - the better! Economical sense: how much revenue per a dollar of Current Assets (MobA), or how many times the MobA actually turn themselves around per a production cycle.
Turnover period = (360 * MobA) / sales. Indicates the number of days necessary for generating the revenue.
|